This briefing examines how migrants affect public finances in the UK. It looks at what past studies have found, why it is difficult to establish a definitive estimate of migrants’ fiscal contributions, and how the UK compares to other countries. It is part of a Full Fact project to inform the 2015 General Election.
-
Key Points
- The net fiscal impact of immigration is the difference between the taxes and other contributions migrants make to public finances, minus the costs of the public benefits and services they receive.
More… - There is no single ‘correct’ estimate of this impact. Results of existing studies all depend on the methodology and the assumptions researchers must make (for example, about whether to include the costs of educating UK-born children of migrants).
More… - Most studies suggest that the fiscal impact of migration in the UK is relatively small (costing or contributing less than 1% of the country’s overall Gross Domestic Product (GDP).
More… - The fiscal impact depends on the characteristics of migrants. Migrants who are young, skilled and working in highly-paid jobs are likely to make a more positive net fiscal contribution than those working in low-wage jobs or with low employment rates.
More… - Migrants from the European Economic Area (EEA) and recent migrants are more likely to have a positive net fiscal impact / less likely to have a negative net fiscal impact.
More… - The net fiscal impact of immigration is slightly more positive in the UK than in other wealthy countries, according to international evidence for the years 2007-2009.
More…
- The net fiscal impact of immigration is the difference between the taxes and other contributions migrants make to public finances, minus the costs of the public benefits and services they receive.
There is no single ‘correct’ answer to the question of how much migrants contribute to public finances
The net fiscal impact of immigration is the difference between the taxes and other contributions migrants make to public finances, minus the costs of the public benefits and services they receive.
For various technical reasons, establishing the fiscal impact of immigration is a challenge. Not everyone agrees on how to calculate it, which makes it difficult to make strong claims about the exact size of migration’s fiscal impacts. In particular, assumptions need to be made about:
- How migration affects the costs of providing public services and what impacts it has on economic growth and unemployment.
- Which costs to attribute to migrants, such as the costs of educating the UK-born children of migrants, or the cost of things like defence spending that do not depend on the size of the migrant population.
- Whether to take a snapshot of the fiscal impact in a given year or period based on historical data (the ‘static approach’), or attempt to consider impacts over migrants’ entire lifetimes.
Most studies have found that the positive or negative impact of migration is less than 1% of GDP
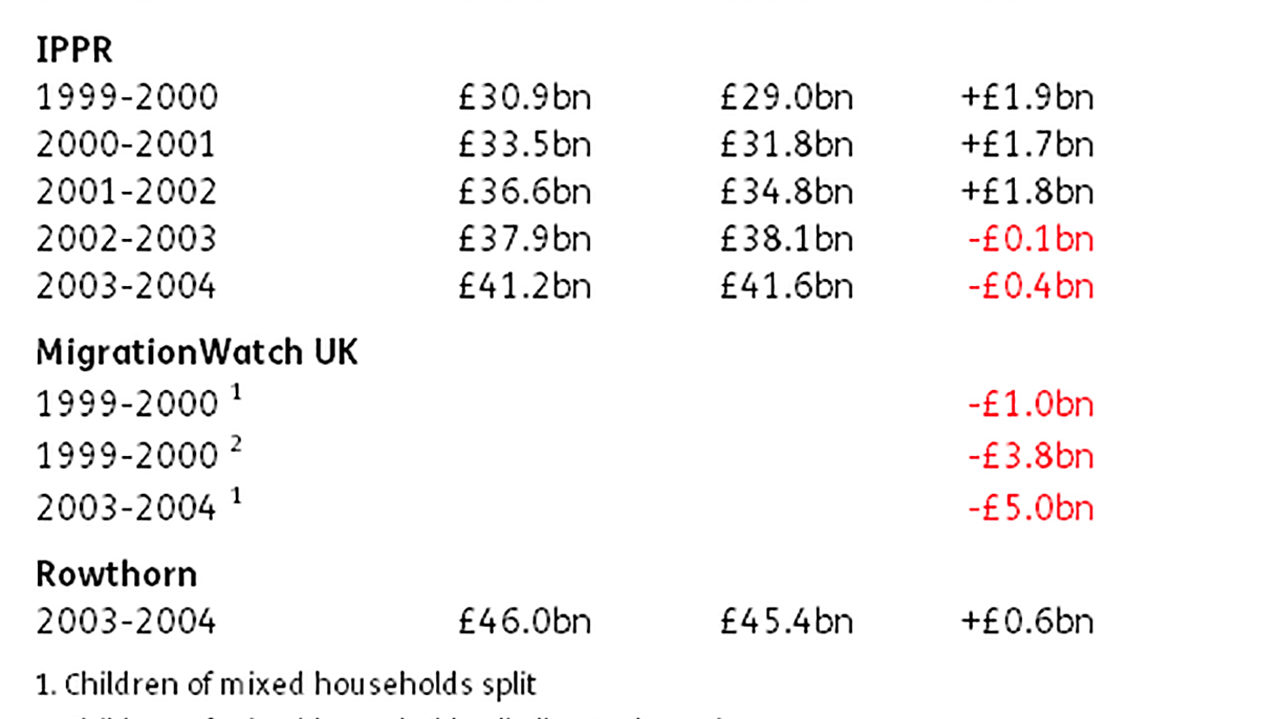
Attempts at analysing the fiscal impact of immigration in the UK started about a decade ago with a Home Office report. The report found that for the fiscal year 1999-2000 (that is, April 1999 to March 2000) migrants in the UK contributed £31.2 billion in taxes and used benefits and state services valued at £28.8 billion. So the net fiscal contribution of all migrants taken together was approximately +£2.5 billion in 1999-2000.
A report from the Institute for Public Policy Research (IPPR) in 2005 found that both revenues from and expenditure on migrants grew between 1999-2000 and 2003-2004. Expenditure attributed to immigrants grew by more, resulting in a negative impact of -£0.4 billion in 2003-4. Because the UK was running a budget deficit in fiscal years 2002-2003 and 2003-2004, however, the UK born population also had a negative fiscal impact. The study found that migrants’ impact was less negative than the impact of UK born people.
A 2008 study by the University of Cambridge economist, Robert Rowthorn, calculated that the migrant contribution in 2003-4 would have been about +£0.6 billion if the UK had been running a balanced budget. This study also adjusted how costs are attributed to migrants. (For example, it assumed higher costs for things like asylum support and certain medical services like HIV treatment; it also considered that some types of public spending, such as defence, are broadly unaffected by migrant numbers.)
A 2006 report by MigrationWatch UK challenged previous studies’ decision to assign the cost of services for children born to one migrant and one UK-born parent on the UK-born group, and argued towards splitting this spending in equal parts between the UK-born and foreign-born groups. The resulting estimates suggested that the net fiscal impact of migrants was negative (-£1 billion for 1999-2000 and -£5billion for 2003-2004). Alternative estimates allocating all children of mixed couples to the migrant group show the fiscal cost of migrants to be much higher (around -£3.8 billion in 1999-2000).
Table 1 provides a summary of the findings for the UK for the fiscal years 1999-2000 to 2003-2004.
Table 1 – Comparison of different estimates of the fiscal effects of immigration for the fiscal years 1999-2000 to 2003-2004 (in GBP billion)
Estimated fiscal impacts of European Economic Area (EEA) migrants and of recent migrants are more positive than those of non-EEA and longer-established migrants
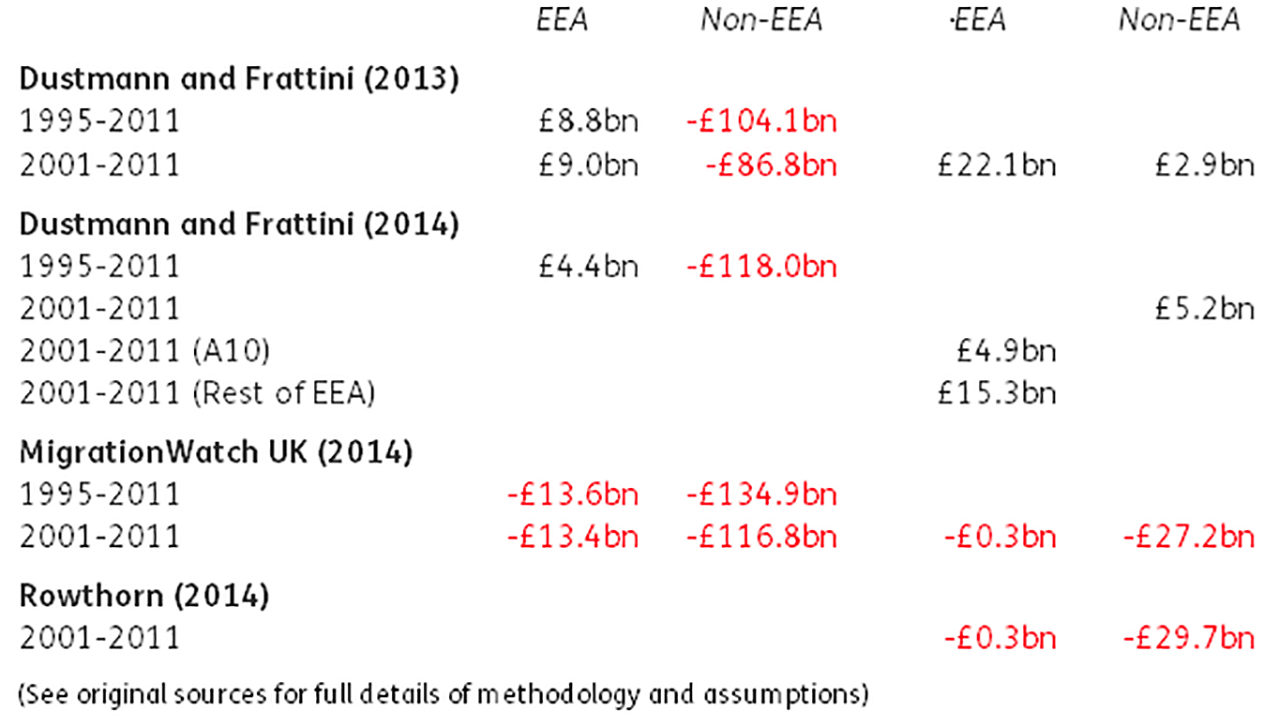
EEA/non-EEA: Recent studies have found that the net fiscal impact of European migrants is more likely to be positive, while that of non-European migrants is more likely to be negative. Two UCL reports by Christian Dustmann and Tommaso Frattini in 2013 and 2014, respectively, came to this conclusion. The second, updated report estimated that during the years 1995-2011 the total fiscal impact of EEA migrants in the UK was about +£4.4 billion (an annual average of close to +£0.3 billion per year). The total fiscal impact of non-EEA migrants for this period was estimated at -£118.0 billion (an annual average of close to -£6.9billion). The UK born during the same period had a net fiscal cost of £591 billion.
Recent migrants: The 2014 UCL report also found that recent migrants (those who arrived since 2000) made more positive fiscal contributions than longer-established migrants. It estimated net fiscal impacts of +£5.0 billion for recent migrants from the ten countries that joined the EU in 2004 (A10 countries), and +£15.3 billion for other recent EEA migrants. Recent non-EEA migrants had an estimated positive impact of +£5.2 billion. The study finds that while A10 migrants worked mostly in lower wage occupations, they were also more likely to be employed, offsetting the impact of their lower wages. Varying estimates of recent/non-recent and of EEA/non-EEA migrants
Using different assumptions, a MigrationWatch UK study found that all four groups (EEA, non-EEA, recent EEA and recent non-EEA) had negative fiscal impacts during the 1995-2011 period. It was consistent with the UCL study, however, in finding that non-recent and non-EEA migrants had more negative impacts than recent migrants and EEA migrants.
Commenting on the 2013 UCL study, Robert Rowthorn argued that the estimates understated the fiscal cost of migration because they did not account for evidence that migration may displace British workers. After this and other adjustments he found a negative impact of recent EEA migration of about £-0.3 billion and a negative impact of recent non-EEA migration of £-29.7 billion.
Table 2 – Comparison of different estimates of the fiscal effects of immigration for the fiscal years 1995-2011 and 2001-2011 (billion, 2011 GBP equivalent)
Long-term fiscal impacts of immigration
In 2013, the Office for Budget Responsibility (OBR) examined how the long-term fiscal sustainability of the UK might change over a 50-year period, depending on the level of migration to the country and expecting the same fertility rate for migrants and the UK born population. Unlike the studies discussed above, the long-term estimates look at the fiscal impacts of at anticipated future migration flows, rather than migrants who are already in the country; they also implicitly account for the impacts of migrants’ children once they enter the workforce. The OBR found that:
- Higher net migration would reduce pressure on government debt over a 50-year period. Based on OBR projections, the high net-migration variant resulted in a public sector net debt as a share of GDP at 73% by 2062-3. The zero net-migration variant resulted in a public sector net debt as share of GDP of 145% the same year.
- This result was driven by the fact that incoming migrants are more likely to be of working age than the population in general. The OBR noted that over an even longer time horizon than 50 years, these migrants would also retire and add to age-related spending pressures. It concluded that “higher migration could be seen as delaying some of the fiscal challenges of an ageing population rather than a way of resolving them permanently”
Cross-country evidence on short-term impacts
The OECD estimated the short-term fiscal impact of immigration in 27 wealthy countries. Its calculations for the years 2007-2009 suggested that:
- The fiscal impact of migration in the UK (which the OECD put at +0.46% of GDP) was more positive than the average fiscal impact of migration across the countries studied (+0.35% of GDP). The UK impact was more positive than in 16 of the countries, including Germany, France, Canada and Australia.
- 10 countries experienced a more positive fiscal impact from migration than the UK, including Switzerland, Belgium, Spain and Portugal.
- The OECD country with the most positive fiscal impact from migration was Luxembourg (+2% of GDP), while the country with the most negative estimated fiscal impact from migration was Germany (-1% of GDP).
- These differences were explained by several factors, according to the report’s authors. Employment (that is, whether or not migrants found work) was the most important one. The reason for migration (e.g. whether migrants come for work, family, or other reasons) and migrants’ age at arrival also played a role, with younger migrants contributing more over the course of their life cycles.
For a more detailed analysis complete with academic references and further suggested reading see our full briefing ‘The Fiscal Impact of Immigration to the UK‘.
Thanks to Robert Rowthorn for helpful comments and suggestions on an earlier version of this work.
This project has been funded by the Nuffield Foundation but the content is the responsibility of the authors and of Full Fact, and not of the Nuffield Foundation.