
This briefing provides an overview of the UK’s migrant population. It looks at how many migrants there are in the UK, where they live, and where they are from.
-
Key Points
- At the time of the 2021/22 Census, 16% of people in the UK had been born abroad – a total of around 10.7 million migrants. Although the foreign-born population has increased further between 2021 and 2024, no reliable data are available for later years.
More… - India, Poland, Pakistan, Romania, and Ireland were the most common countries of birth among UK migrants in 2021/22. Together, the top five countries of origin accounted for 32% of all those born abroad.
More… - Family was the most common reason for coming to the UK among the foreign-born population in 2022, followed by work. Moving to the UK for work was more common among EU migrants, particularly those from newer member states in Central and Eastern Europe.
More… - London has the largest proportion of migrants among UK regions, with over 40% of its residents born abroad. In 2021/22, almost half of all foreign-born residents in the UK lived in London and the South East.
More… - Compared to people born in the UK, migrants are more likely to be of working age or have a university degree. In 2021, a majority of those born abroad had been in the country for 10 years or more.
More…
- At the time of the 2021/22 Census, 16% of people in the UK had been born abroad – a total of around 10.7 million migrants. Although the foreign-born population has increased further between 2021 and 2024, no reliable data are available for later years.
-
Understanding the Evidence
This briefing defines the migrant population as the foreign-born population in the UK. Where relevant, the briefing also provides figures for foreign citizens residing in the UK. Definitions greatly affect the estimated number of migrants in the UK, and there is significant overlap between those who belong to the foreign-born group and those who belong to the foreign-citizen group. ...Click to read more.For more information about how migrants are defined, see the Migration Observatory’s briefing, Who Counts as a Migrant?
The data in this briefing are taken from four main sources – the 2021 England and Wales Census, the 2021 Northern Ireland Census, the 2022 Scotland Census, and the Office for National Statistics’ Annual Population Survey (APS).
Scotland conducted its latest census in 2022, a year later than the rest of the UK. In this briefing, we primarily use data from the latest round of the census. Figures are obtained by summing up 2021 data from England, Wales, and Northern Ireland with 2022 data from Scotland, and are labelled ‘2021/22 Census’. Although some inconsistencies arise from the use of data from different years and hence care is needed when interpreting the results, these are the most accurate figures available on the UK’s migrant population.
There are important flaws in estimates produced using the APS, particularly in the post-pandemic period. Some groups are excluded from the design of the survey, such as residents of communal establishments like hostels and certain students in halls of residence. More importantly, other groups may be undercounted due to survey non-response. The response rate of the APS, which had already been declining, collapsed during the COVID-19 pandemic and continued falling thereafter. This means that groups who are less likely to respond to the survey may be undercounted (for more details, see the Migration Observatory’s commentary, Where did all the migrants go? Migration data during the pandemic).
Non-response is a more significant issue among foreign-born individuals, meaning it poses a particular threat to the accuracy of migration-related estimates produced using the APS. In response to the falling response rate of the APS, the ONS attempted to correct APS estimates using weights derived from other sources like the HMRC’s Migrant Worker Scan. However, after the release of data for the year ending June 2021, the ONS officially discontinued its data series on the UK’s population by country of birth and nationality. As of June 2024, there were no official data on the UK’s migrant population beyond 2021. The ONS has committed to developing new statistics, including those based on its transformed Labour Force Survey. Further updates are expected in autumn 2024.
In this briefing, some population estimates are constructed using microdata from the APS for 2021-23 (previous APS-based estimates in this briefing are taken from official statistics). However, caution needs to be used when interpreting these estimates, which underestimate the foreign-born population of the UK. The data are likely to be less accurate for smaller population groups, such as migrants in particular age brackets or those born in specific regions of the world. In the analysis of this briefing, we default to our estimates based on the 2021/22 Census, which are significantly more reliable.
At the time of the 2021/22 Census, 16% of people in the UK had been born abroad
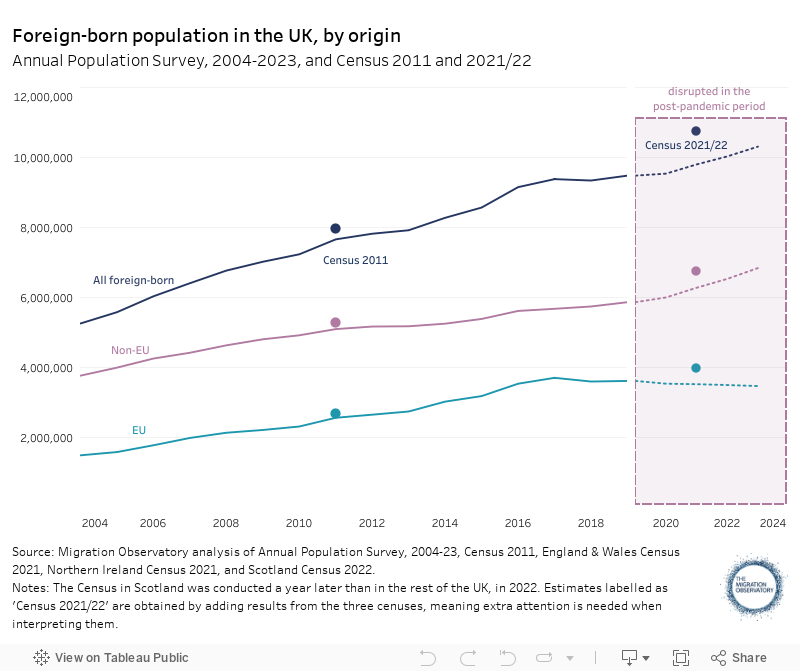
The UK’s foreign-born population increased rapidly between 2004 and 2021. According to data from the latest Census – which combines 2021 data from England, Wales, and Northern Ireland with 2022 data for Scotland – it stood at 10.7 million. That means that 16% of people in the UK, which had a total estimated population of 66.9 million, had been born abroad. The number of foreign-born residents had increased by 34% since the 2011 Census (Figure 1).
The precise size of the foreign-born population between 2021 and 2023 remains uncertain, although it has continued to increase. According to official net migration estimates, in 2022 and 2023 combined, migration added 1.4 million people to the population (for more details, see the Migration Observatory’s briefing, Net migration to the UK). However, this increase is not yet fully reflected in official population estimates, due to problems in data collection after the pandemic (see Understanding the Evidence, above).
Most migrants in the UK were born in non-EU countries – 63%, according to the latest census. Indeed, the EU-born population in the UK is likely to have fallen in the early 2020s – net migration from EU countries became negative after 2021, with immigration from the bloc at low levels under the new immigration system (for more details, see the Migration Observatory’s briefing, EU Migration to and From the UK).
Figure 1
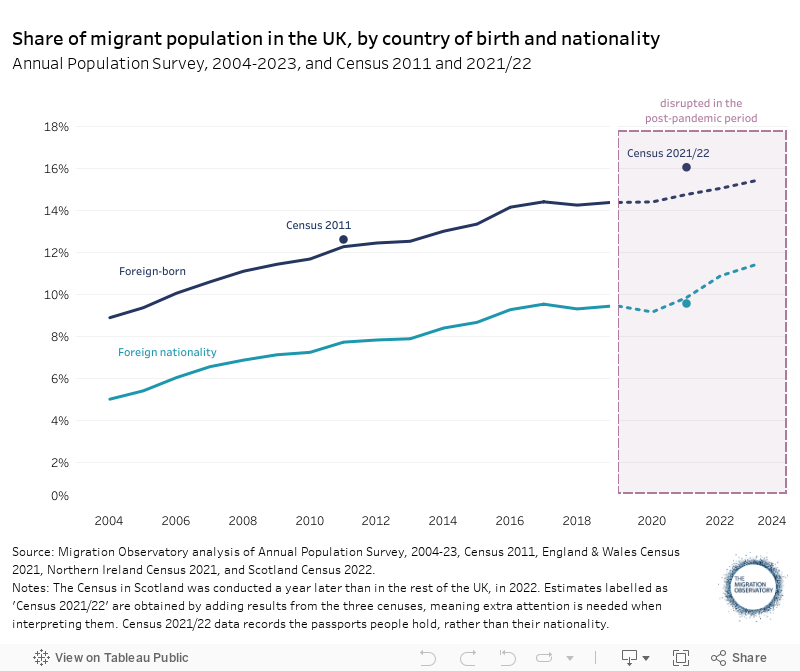
The foreign-born population made up 9% of the UK’s total population in 2004. At the time of the 2021/22 Census, this had risen to 16%. The share of foreign citizens rose from 5% to 10% in the same period (Figure 2).
The foreign-born share of the population typically rises more than the non-citizen share, since many migrants become British citizens over time. Historically, migrants from the EU have been less likely to naturalise than those from non-EU countries. This remained the case after Brexit despite an increase in citizenship applications among EU nationals (for more details, see the Migration Observatory’s briefing, Citizenship and naturalisation for migrants in the UK).
The non-citizen population also includes some children born in the UK. About 360,000 UK-born children who were not British citizens were living in England and Wales in 2021, according to the Census (for more details, see the Migration Observatory’s briefing Children of migrants in the UK).
Figure 2
India, Poland, Pakistan, Romania, and Ireland were the most common countries of birth among UK migrants in 2021/22
According to the 2021/22 Census, an estimated 32% of all foreign-born residents in the UK came from five countries – India (9%), Poland (8%), Pakistan (6%), Romania (5%), and Ireland (4%).
Figure 3

Family was the most common reason for coming to the UK among the foreign-born population in 2022, followed by work
The most common reason given by migrants for moving to the UK was family (37%), followed by work (29%) and study (14%) in 2022, the latest year for which data was available.
The large share of family migrants among the UK’s foreign-born population is due to different settlement patterns among migrant groups. While people coming on family visas make up a relatively small part of overall immigration into the UK, they are much more likely to settle permanently (for more details, see the Migration Observatory’s briefings, Migrant settlement in the UK and Family migration to the UK).
Figure 4
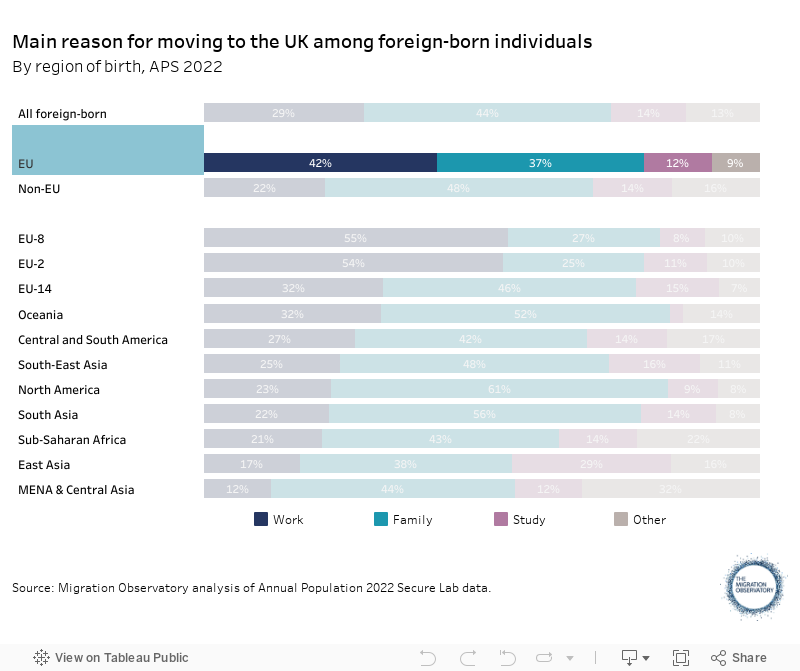
Work was the main reason for coming to the UK among EU migrants, while non-EU migrants were more likely to say they came for family reasons (Figure 6). The share of work migrants is particularly high among those from newer EU member states in Central and Eastern Europe. For more details about work migration and the jobs migrants do in the UK, see the Migration Observatory’s briefings, Work visas and migrant workers in the UK and Migrants in the UK Labour Market: An Overview.
Moving to the UK to study was relatively less common among the UK’s foreign-born population, at 14% of the total. While the UK receives large numbers of international students, relatively few of them settle in the country permanently. For more details about international students, see the Migration Observatory’s briefing, Student migration to the UK.
Another 11% of all migrants said they came to the UK for other reasons, which includes humanitarian protection. Britain saw higher numbers of asylum applications after the pandemic. In addition, the government created several bespoke humanitarian routes in response to the geopolitical situations in Ukraine, Afghanistan, and Hong Kong. For more details, see the Migration Observatory’s briefings, Asylum and refugee resettlement in the UK, Ukrainian migration to the UK, and Afghan asylum seekers and refugees in the UK.
London has the largest proportion of migrants among UK regions, with over 40% of its residents born abroad
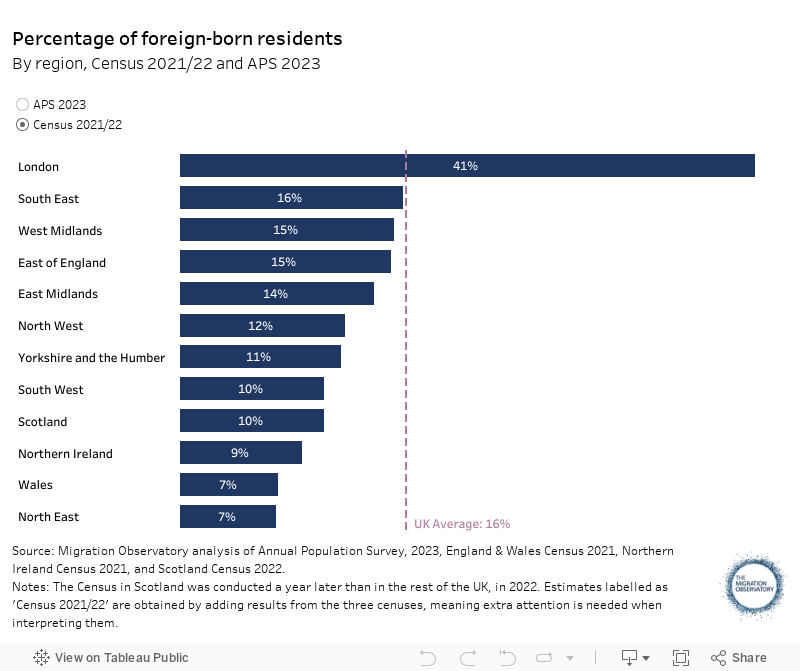
Migrants are much more concentrated in some parts of the UK than others. Around 47% of all foreign-born residents in the UK lived in London and the South East at the time of the 2021/22 Census. This compared to just 27% of the overall population (for more details, see the Migration Observatory’s briefing, Where do migrants live in the UK?).
London stands out among all other regions in the UK. More than 40% of its residents had been born abroad, according to the 2021 Census. The national average was 16%, and percentages were below this average in all other regions of the country (Figure 4). The North East (7%), Wales (7%), and Northern Ireland (9%) had the lowest shares of foreign-born residents (for more details at the local authority level, see the Migration Observatory’s Local Data Guide).
Figure 5
Compared to people born in the UK, migrants are more likely to be of working age and have a university degree
Most migrants in the UK are between the ages of 20 and 60. Around 72% of the foreign-born population was in this group, according to data from the 2021/22 Census. In contrast, the share among those born in the UK was 49%. Migrants were also less likely to be in their childhood or retirement years.
On average, migrants from the EU tend to be younger than those born in non-EU countries (see Figure 6 to select and explore different groups). This difference is driven by migrants born in post-2004 member states like Poland, Romania, or Lithuania.
Figure 6
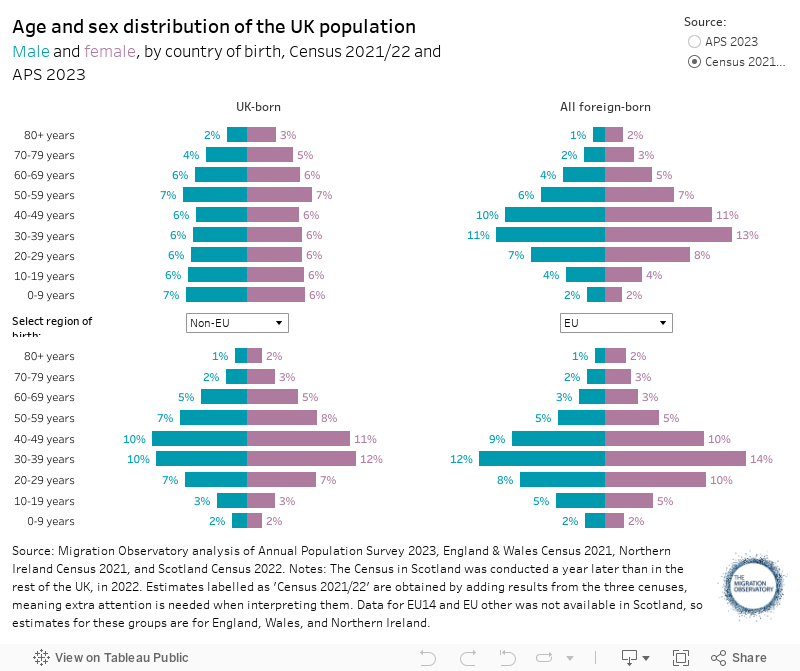
According to the latest Census, migrants were slightly more likely to be female than people born in the UK, at 53% vs. 51%. These differences were especially pronounced among migrants born in East or Southeast Asia (60% female), and the Americas and Caribbean (57% female).
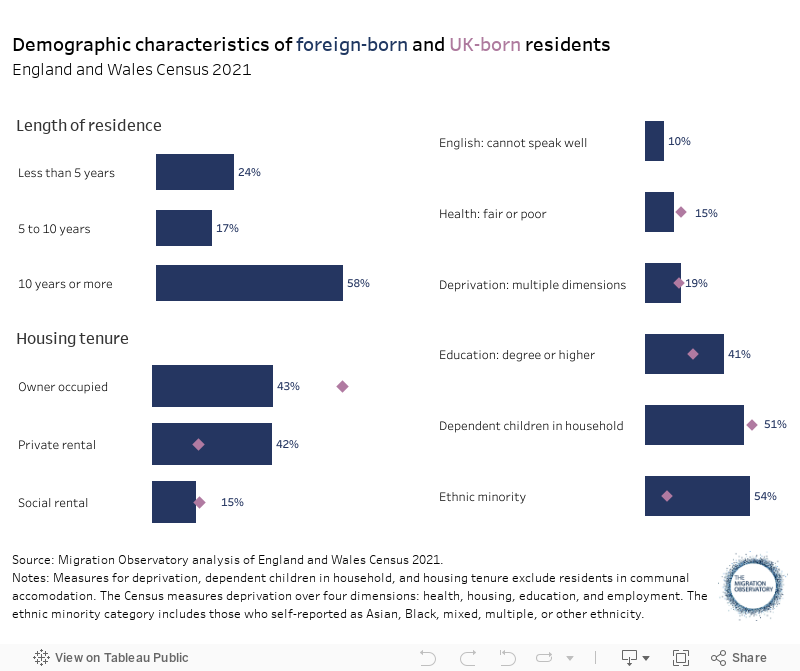
There are other key differences between migrants and people born in the UK (Figure 7). According to the 2021 Census in England and Wales, 41% of those born abroad had a university degree, compared to 25% of people born in the UK. Migrants were more ethnically diverse, healthier, and more likely to live in privately rented accommodation. Around 10% of migrants reported poor levels of English, while household deprivation levels were similar to the rest of the population. The same data showed that 58% of migrants in England and Wales had been living in the UK for at least 10 years.
For more details about the characteristics of migrants in the UK, see the following Migration Observatory briefings: Migrants and Housing in the UK, The health of migrants in the UK, Deprivation and the NRPF condition, English language use and proficiency of migrants in the UK, and Permanent or Temporary: How long do migrants stay in the UK?.
Figure 7
Acknowledgements
The original iteration of this briefing was written by Dr Cinzia Rienzo.