This briefing describes remittance flows both to and from the UK. Remittances are transfers of money from residents of one country to residents of another country and are often associated with migrants sending money to families and their communities.
-
Key Points
- At around £9.3bn in 2023, remittances from the UK remain lower than before the pandemic when adjusted for inflation. However, official figures are likely to be a significant underestimate.
More… - India, Pakistan, and Nigeria were the top destinations for remittances from the UK according to the most recent estimates. Countries most dependent on remittances from the UK included Bermuda, Somalia, and Jamaica.
More… - At around 6%, the average cost of sending remittances from the UK has fallen over the years but remains above official targets.
More… - The cost of sending remittances from the UK varies widely by country and method, with Pakistan and India as the cheapest destinations. Cash transfers tend to be most expensive, particularly compared to bank transfers.
More… - Around a third (32%) of non-EU migrants sent remittances from the UK in 2021/22, compared to 13% of those from the EU. In contrast, 8% of people born in the UK sent money abroad.
More…
- At around £9.3bn in 2023, remittances from the UK remain lower than before the pandemic when adjusted for inflation. However, official figures are likely to be a significant underestimate.
-
Understanding the Evidence
Since the end of foreign exchange controls in the UK in 1979, there have been no official mechanisms for recording international monetary transactions, including remittances. The Office for National Statistics does not publish estimates of remittances to and from the UK. The discussion below mostly focuses on estimates from the World Bank based on balance of payments data, which cover overall inflows and outflows in each country. These estimates are likely to significantly underestimate the total amount of remittances. Such flows are difficult to capture, in part because a significant proportion of them may occur through unofficial and unrecorded channels, such as friends and relatives carrying cash while travelling.
Up to 2021, the World Bank also published a yearly Bilateral Remittance Matrix (BRM) which covered flows between most countries where data were available. These were econometric estimates based on models which included the size of the migrant population in each country, its origins, and relative incomes across different economies. These have since been discontinued, and there are now no publicly available data which disaggregate remittance flows between different destinations.
Data on the cost of sending remittances also comes from the World Bank – its Remittance Prices Worldwide database. These are updated quarterly and cover a sample of the most commonly used methods and service providers in each remittance corridor. Averages are not weighted according to the amount of money that is transferred using each method.
At around £9.3bn in 2023, remittances from the UK remain lower than before the pandemic when adjusted for inflation
Remittances are difficult to measure, and official data only capture a limited proportion of all transfers (see Understanding the Evidence). According to the best available estimates from the World Bank, migrants in the UK sent £9.3bn in remittances back to their home countries in 2023. In nominal terms, this was a record level. Remittances declined during the pandemic but then recovered swiftly. However, when adjusted for inflation, remittances fell in 2023 and remained lower than the levels seen between 2016 and 2019 (Figure 1).
Remittances from the UK make up a smaller share of the economy than in many other countries. In 2023, remittances were equivalent to 0.34% of GDP – placing the UK as 107th out of 148 countries where data were available. Germany and France, which have a similar proportion of foreign-born residents, both saw a higher share of GDP remitted in 2023 (0.51% and 0.65% respectively).
However, these figures are likely to be a significant underestimate of the amount of money sent by migrants from the UK. Up to 2021, the World Bank also produced estimates of global remittances based on the number of migrants in each country and their relative incomes. These placed remittances from the UK much higher, at around £24.5bn in 2021, compared to official estimates of £7.5bn.
Figure 1
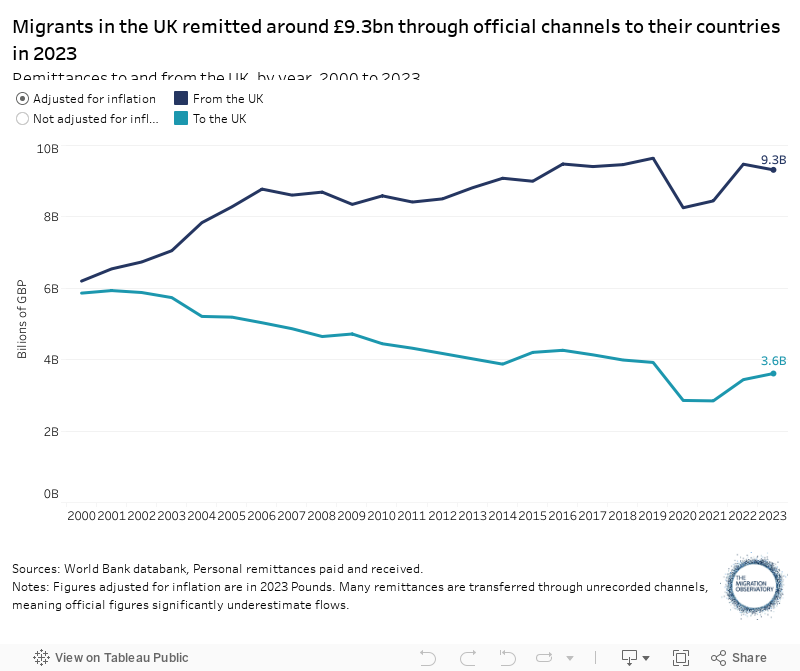
The UK also receives remittances from people outside the country. These are considerably lower, at around £3.6bn in 2023. This amount has stayed relatively constant over the last two decades – meaning that the amount of remittances sent to the UK has declined considerably when adjusted for inflation (Figure 1). As with remittances sent, these figures are likely to be underestimated.
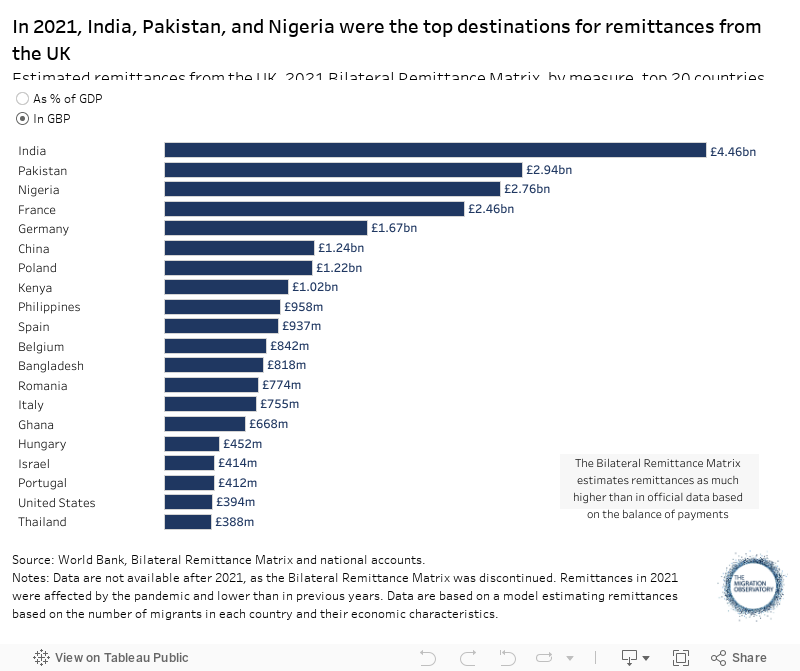
India, Pakistan, and Nigeria were estimated to be the top destinations for remittances from the UK in 2021
There are no recent data on the destination of remittances from the UK. The latest estimates from the World Bank are from 2021, based on the number of migrants in each country and their relative incomes.
According to these, the top destinations for remittances from the UK were India, Pakistan, and Nigeria – all countries with large diasporas in Britain (Figure 2). However, it is unclear how these patterns have changed in the last few years, as we know that overall remittances recovered after the pandemic, and many new migrants arrived in the UK.
The ranking changes significantly when we look at which countries are most dependent on remittances from the UK relative to the size of their economy. Remittances from the UK to Bermuda made up around 5% of its GDP, followed by Somalia, Jamaica, and the Gambia (Figure 2).
Figure 2
At around 6%, the average cost of sending remittances from the UK has fallen over the years but remains above official targets
Migrants in the UK send money home using several channels. These include banks and money transfer operators (MTOs) like Western Union, but also a variety of informal methods that are difficult to trace, such as relatives and friends travelling to their home countries with cash. Sending remittances via banks and MTOs is typically not free.
In the first half of 2024, the average cost of sending remittances from the UK was around 6%. This meant that migrants paid around £7.30 to send the reference amount of £120. Average costs have declined steadily over the last fifteen years, including after the pandemic, which reduced the use of expensive transfers using cash submitted in person (Figure 3).
Figure 3
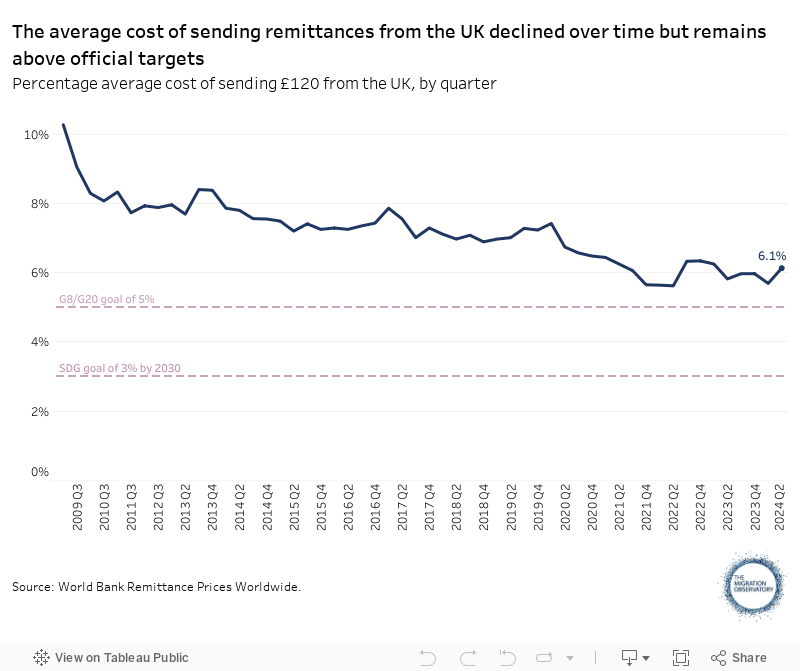
However, costs remain higher than the goals set by governments and international organisations. Together with other G8 countries, the UK set a target in 2009 of reducing the global average cost of sending remittances to 5% within five years – which remains unattained. The UN also aims to reduce average transaction costs to 3% by 2030 as part of its Sustainable Development Goals.
It is important to note that there are other barriers to remitting beyond cost. These include insufficient technical skills, a lack of necessary documentation among refugees, and limited availability of providers and other means of transfer.
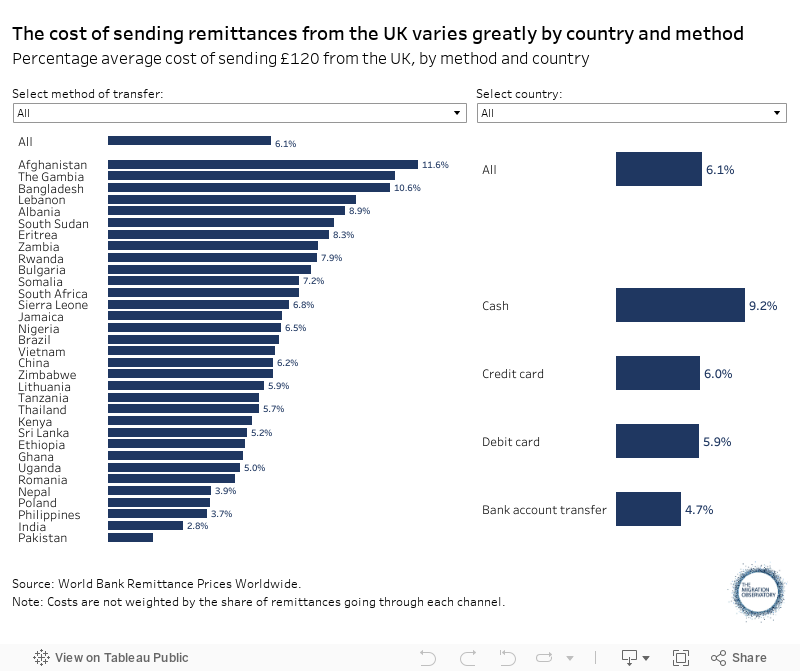
The cost of sending remittances from the UK varies widely by country and method, with Pakistan and India as the cheapest destinations
The cost of sending remittances from the UK varies greatly by both country and method. For example, it cost less than 1% to send £120 from the UK to Pakistan through a bank transfer in the second quarter of 2024. At the same time, it cost around 17% to send the same amount to Lebanon in cash (Figure 4).
Cash transfers – remittances that are paid in cash both in the UK and at the destination – tend to be the most expensive, while bank transfers are considerably cheaper. On average, sending remittances in cash cost around 9.6% in the second quarter of 2024, almost twice as much as for bank transfers.
Pakistan and India were the cheapest destinations for sending remittances from the UK in 2024, with average costs below the 3% goal set by the UN. These were also the top destinations for remittances from the UK according to the most recent data. In contrast, the most expensive destinations were Afghanistan, The Gambia, and Bangladesh (Figure 4).
Figure 4
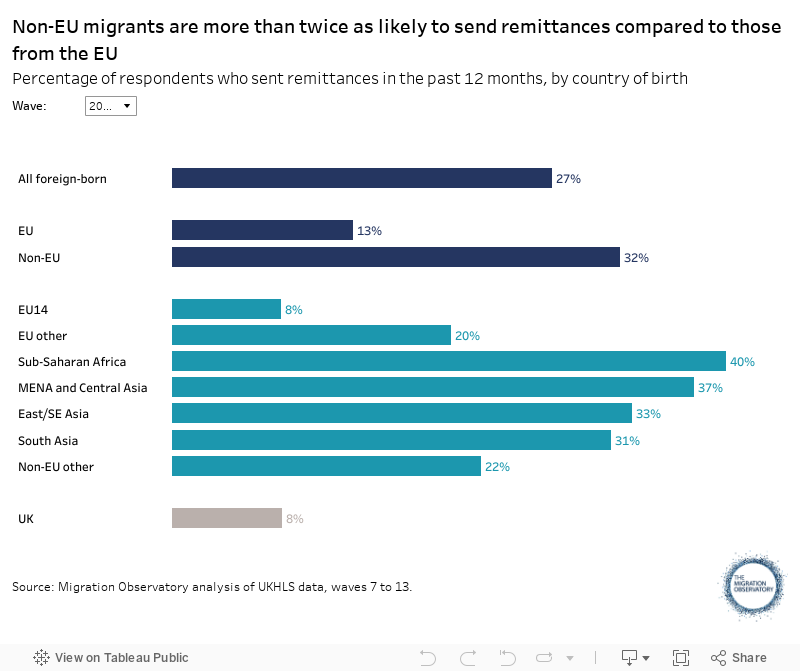
Around a third of non-EU migrants send remittances from the UK in 2021/22, compared to 13% of those from the EU
Around 27% of all those born abroad sent remittances in 2021/22, according to data from a long-running UK household survey. Migrants are around three times more likely to send remittances than people born in the UK. These shares have remained relatively constant over the last decade (Figure 5).
Some groups of migrants are much more likely to send remittances from the UK than others. In 2021/22, people born in the EU were least likely to send remittances, particularly those from older member states in Western Europe. In contrast, migrants from Africa and the Middle East were most likely to remit (Figure 5).
Most of those sending remittances from the UK do so to support friends and family – 91% of all remitters were motivated by this. Other reasons included supporting their local communities (11%), repaying a loan (3%), or investing in their home country (3%).
There are very limited data on how much different groups of people send in remittances. A relatively simple calculation – using the total flows from the UK discussed above and the share of UK residents who send remittances according to the survey – would put the average amount remitted in 2021 between £1,000 and £3,300 per person. However, the actual amount is likely to depend on nationality, income, length of residence in the UK, and other demographic characteristics. One study looking at Brazilian, Indian, and Somali migrants in the UK found they sent an average of £2000 in remittances in 2020 – though this was substantially higher among Indians and had declined substantially from the previous year (and the data are not representative of the population). A 2015 report from the World Bank – analysing migrants from Bangladesh, Ghana, Romania, and Somalia living in London – found that men generally sent larger amounts home, up to an average of £3,500 a year among Romanian men.
Figure 5