
This briefing summarises key statistics from the 2011 Census for Wales, and its constituent council areas. The briefing provides information about population levels; the number and population share of foreign-born residents; as well as countries of origin, year of arrival and main languages. Finally, the briefing compares Wales to England and Scotland, and the 2001 and 2011 Census results.
-
Key Points
- In 2011, the total usual resident population of Wales stood at 3,063,456 residents. About 5.5% of those residents (167,871) were born outside of the UK. This represents an increase of 82% in the non-UK born population since 2001.
More… - In 2011, 42% of the non-UK born population held a UK passport, and 52% held only a non-UK passport. The rest (7%) held no passport.
More… - Cardiff had the highest number (45,967) as well as the highest population share (13%) of non-UK born residents in Wales.
More… - Between 2001 and 2011, the total non-UK born population grew numerically the most in Cardiff (22,849 additional residents), but the biggest percentage increase (+227%) took place in Merthyr Tydfil.
More… - Residents born in Poland represent the most numerous non-UK born group in Wales (18,023 residents), followed by residents born in Ireland, India, Germany and China.
More… - In both 2001 and 2011, Wales had a smaller number and population share of non-UK born residents than all the regions of England except the North East as well as than Scotland.
More…
- In 2011, the total usual resident population of Wales stood at 3,063,456 residents. About 5.5% of those residents (167,871) were born outside of the UK. This represents an increase of 82% in the non-UK born population since 2001.
-
Understanding the Evidence
The census is the most complete source of information about the population. It is particularly useful for obtaining population estimates for small geographical areas and information on the characteristics of such a population. Other sources of information on population characteristics in the UK such as the Labour Force Survey have large margins of error at the local level, because they are based on survey data and rely on a limited number of observations at the local level. The census is based on a count of people and households, with efforts to include everyone, but it is supplemented by a survey to detect and estimate those who are missed at first.
The latest UK censuses were conducted during 2011, with 27 March 2011 as the official census day of record. In England and Wales the census was conducted by the Office for National Statistics (ONS), the National Records of Scotland in Scotland, and the Northern Ireland Statistics and Research Agency in Northern Ireland. There are different release dates for the data in these censuses (including the migration-related data). Therefore, when comparing Wales to other parts of the UK, the current briefing uses only information from the ONS 2011 Census releases for England and Wales.
When analysing the nature of migration, defining who counts as a migrant is of crucial importance. Yet there is no consensus on a single definition of a ‘migrant’. Different datasets—and analyses from these datasets—use a variety of definitions of ‘migrant,’ including (1) country of birth, (2) nationality, (3) passports held, (4) length of stay, (5) reason for migration and (6) being subject to immigration controls. For example, people who are foreign-born are not all foreign nationals; likewise, some foreign nationals may have lived in the UK for decades while others reside in the UK for only a year. Some are the children born abroad of UK national parent(s)–e.g. service personnel. Others are long-term residents who have acquired British citizenship.
The data analysed in this briefing are based mainly on the census statistics for country of birth as well as passports held, not current nationality. The census collected data on passports held, and this can be used as a proxy for nationality; yet nearly 17% of the total usual resident population of England and Wales held no passport in 2011 (ONS, 2013) and data for passports held in not available for 2001, precluding the measure of change over time. When using data on country of birth, it is important to note that many of those included in the foreign-born category will have British citizenship.
The data presented include statistics for usual residents only, unless otherwise specified. Usual residents are defined as anyone in the UK on census day who had stayed or intended to stay in the UK for 12 months or more (or were outside the UK but had a permanent UK address and intended to stay outside the UK for less than 12 months). In terms of countries of birth, data are available for 160 countries as part of regional totals. At the local level, however, data have not been provided for all countries of origin. Instead, the ONS has identified 27 key countries of origin most common at the national level, and all local analyses of the most frequent countries of origin only refer to the most frequent countries out of the 27 key countries of origin. As such, particularly at the local level, there may be other more numerous foreign-born groups that the current census release does not include. However, the totals for each region of origin are available for local areas.
See the Migration Observatory video interview of Peter Stokes, 2011 Census Statistical Design Manager, for further discussion.
In 2011, the total usual resident population of Wales stood at 3,063,456 residents. About 5.5% of those residents (167,871) were born outside of the UK. This represents an increase of 82% in the non-UK born population of Wales since 2001
As shown in Table 1, in 2011, the total usual resident population of Wales stood at just over 3 million people, 167,871 of which had been born outside of the UK. This represents 5.5% of the total resident population of Wales (a 72% share increase from 3.2% in 2001). In 2001, the foreign-born population of Wales accounted for 2% of the total non-UK born population of England and Wales; in 2011, this was slightly higher at 2.2%.
Since 2001, the non-UK born population grew by 75,608 persons, accounting for 47% of the total population growth of 160,371 usual residents in the decade. While overall the population of Wales increased by 5.5% between 2001 and 2011, the non-UK born resident population grew by 82% in the same period.
Table 1 – Key census statistics for Wales
| 2001 | 2011 | Change (%) | |
|---|---|---|---|
| Total usual resident population | 2903085 | 3063456 | 5.5% |
| UK-born resident population | 2810822 | 2895585 | 3% |
| Non-UK born resident population | 92263 | 167871 | 82% |
| Non-UK born as share of the region's population | 3.2% | 5.5% | 72.4% |
| Share of non-UK born population of England and Wales | 2% | 2.2% | 12.6% |
| Non-UK passport holders | 93901 | ||
| Non-UK passport holders as share of the region's population | 3.1% |
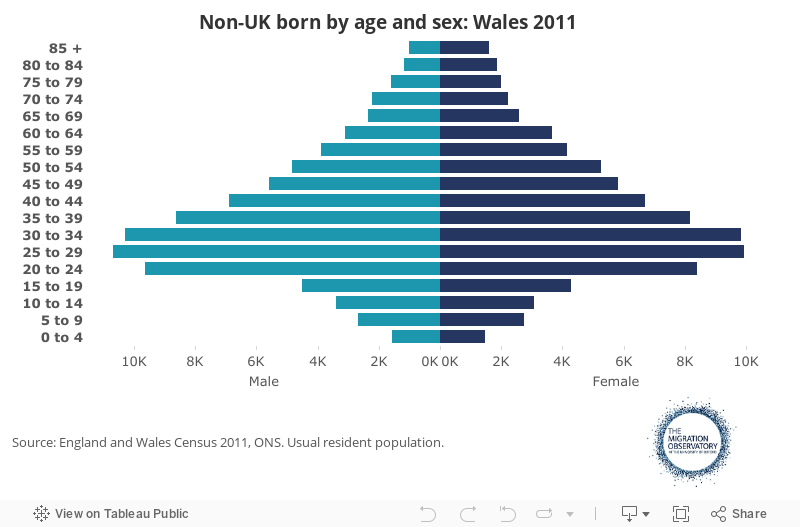
In 2011, 50.1% of Wales’ foreign-born residents were male and 45% were between 20-39 years of age
In 2011, 45% of Wales’ foreign-born residents were aged 20-39 years of age and 71% were aged 20-59 (see Figure 1). In comparison, 23.5% of the UK-born population were between 20 and 39 years old in 2011. The most common age-groups for the non-UK born population of Wales were the 25-29 and 30-34 age-groups, each accounting for 12% of the non-UK born population.
Moreover, of the 167,871 non-UK born residents in 2011, 50.1% were male and 49.9% were female. However, the gender distribution of the non-UK born differed somewhat depending on the age-group; a slight majority of those aged 0-4 and 10-44 were men. Within the non-UK born group, the age-group with the largest male share (53.4%) was the 20 to 24 category. At the same time, the proportion of women tended to increase with age, with over 60% of those aged above 80 being female.
Figure 1
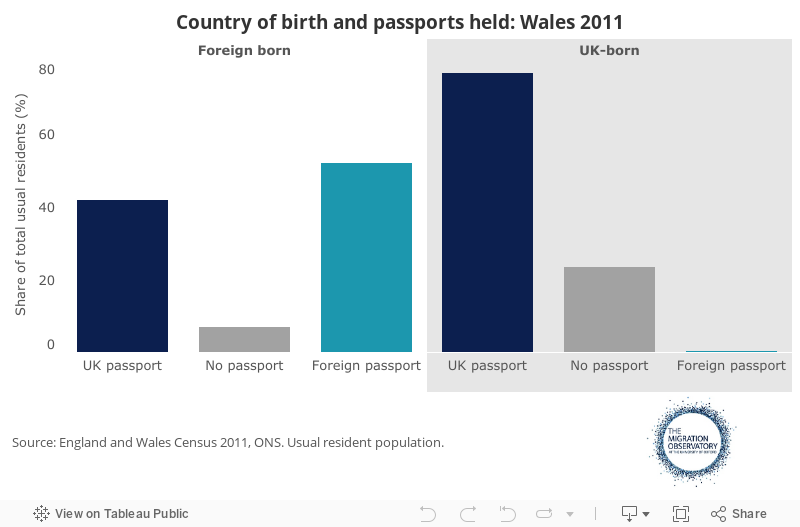
In 2011, 42% of the non-UK born population held a UK passport, and 52% held only a non-UK passport. The rest (7%) held no passport
In 2011, 74.5% of residents of Wales held a UK passport and 3.1% (93,901 usual residents) held only a non-UK passport (see Table 1). At the same time, 22.4% of residents held no passport. It is important to note that for residents with dual passports, priority was given to UK passports and then Irish passports in the census data collection process. Thus, respondents with both a UK and a non-UK passport are included as having a UK passport. In terms of the non-UK born population, 51.6% (86,649 residents) held a UK passport, while 41.6% (69,819 residents) held only a non-UK passport (see Figure 2). Only 6.8% of the foreign-born population (11,403 residents) held no passport.
Figure 2
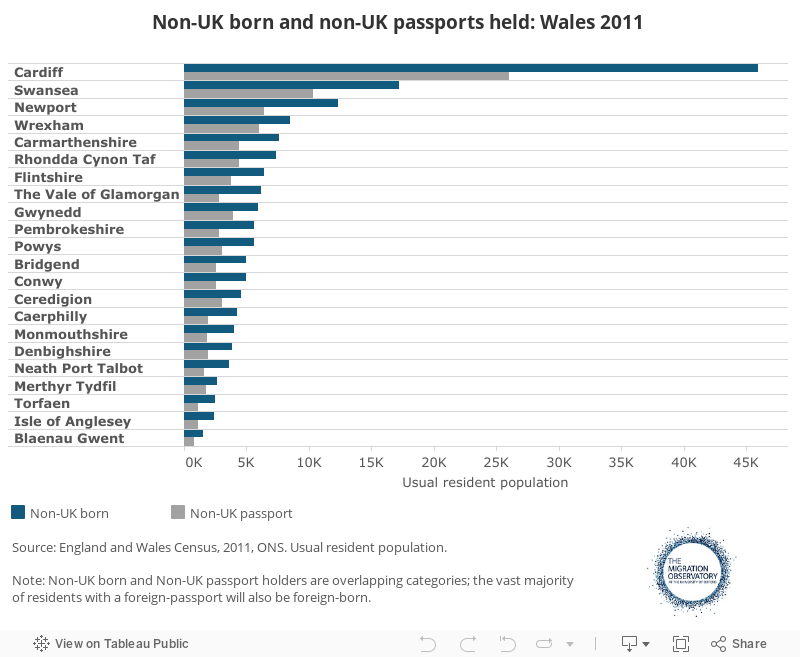
Cardiff had the highest number (45,967) as well as the highest population share (13%) of non-UK born residents in Wales
As shown in Figure 3, out of all the unitary authorities in Wales, Cardiff had the highest number of non-UK born residents, with 45,967 foreign-born residents in 2011. Its foreign-born population accounts for 13.3% of the local resident population. Moreover, its non-UK born population accounts for 27.4% of the total foreign-born population of Wales, while in total Cardiff’s residents represent 11.3% of the resident population of Wales.
In terms of the size of the non-UK born population, Cardiff was followed by Swansea, with 17,233 foreign-born residents in the area in 2011, representing 7.2% of the locality’s usual resident population. In terms of the population share, however, Newport comes out second after Cardiff, with its 12,333 non-UK born residents in 2011 representing 8.5% of the local population. Conversely, the locality with the smallest foreign-born population was Blaenau Gwent (it is important to note here that it is also the third smallest unitary authority in Wales), with 1,502 non-UK born residents representing 2.2% of the local population, also the lowest population share of non-UK born residents in 2011.
In terms of non-UK passports held, Cardiff also had the highest number of residents with only a non-UK passport in 2011, with 25,986 foreign-passport holders accounting for 7.5% of the local population (see Figure 3). This also represents 27.7% of all those with only a non-UK passport in Wales in 2011. Conversely, Blaenau Gwent had the smallest number of residents with only a non-UK passport in 2011, with the estimated 778 residents representing 1.1% of the local population, also the smallest non-UK passport holder population share in Wales.
Figure 3
While there were 167,871 non-UK born persons usually resident in Wales in 2011, there were also 7,177 short-term residents (defined as staying between 3 and 12 months) born outside of the UK in Wales in the same year. As well as having the largest non-UK born resident population, Cardiff also had the highest number (2,968) of non-UK born short-term residents, amounting to 41.4% of all the non-UK born short-term residents in Wales. The lowest number (estimated 17 residents) of non-UK born short-term residents was in the Torfaen unitary authority.
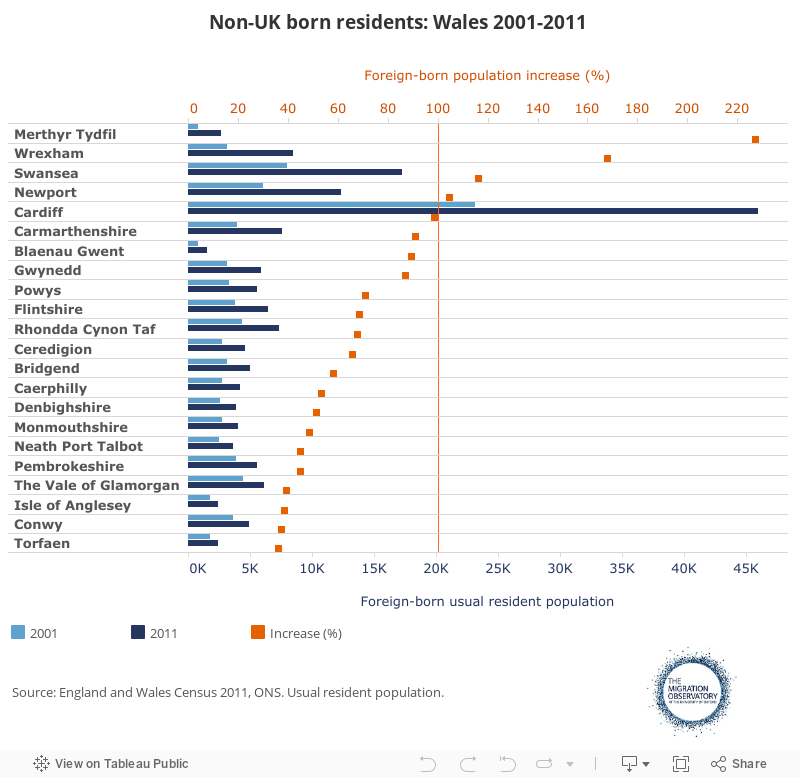
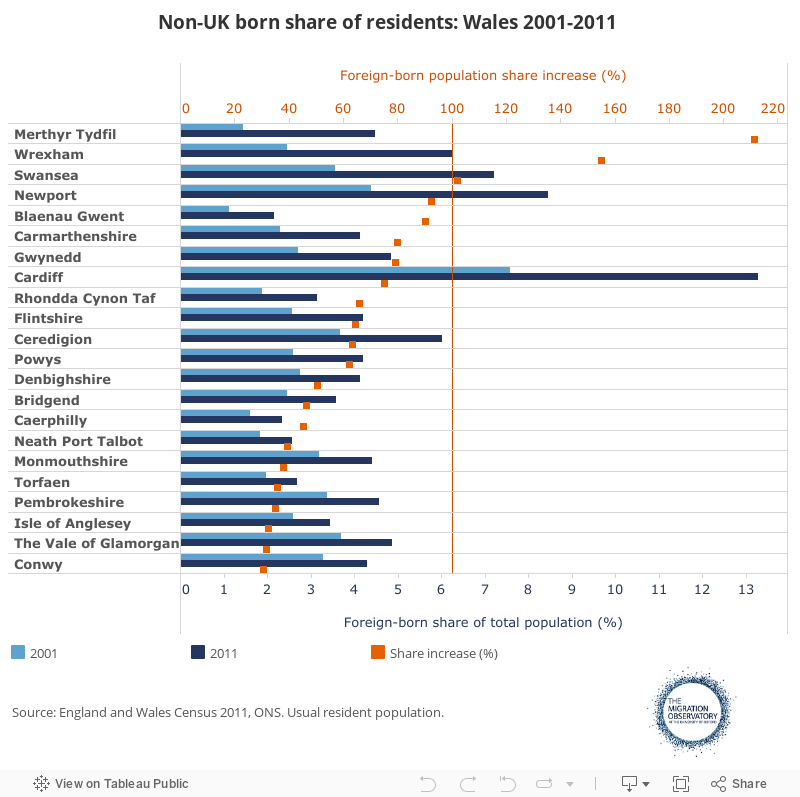
Between 2001 and 2011, the total non-UK born population grew numerically the most in Cardiff (22,849 additional residents), but the biggest percentage increase (+227%) took place in Merthyr Tydfil
Between 2001 and 2011, the non-UK born population increased in each unitary authority within Wales, but to varying degrees and at different speeds (see Figure 4). The largest numerical increase took place in Cardiff, with the number of foreign-born residents rising by 22,849 persons during the intercensal period, representing an increase of 98.8%. The highest percentage increase, however, took place in Merthyr Tydfil, with an increase of 227.3%, from an estimated 807 non-UK born residents in 2001 to 2,641 in 2011. According to the census results, this was the 2nd highest percentage increase in the number of non-UK born residents between the two census years in England and Wales. The second highest percentage increase in the non-UK born population (168%) took place in Wrexham, from 3,160 in 2001 to 8,468 in 2011.
At the same time, the non-UK born population grew by the smallest number of residents in Torfaen, increasing by 651 residents. This presents an increase of 36.3% and is also the lowest percentage increase in the non-UK born population in Wales.
Figure 4
As shown in Figure 5, as the non-UK born population increased in each area of Wales since 2001, so has there been an increase in the foreign-born share of the local population in each Welsh local area. In terms of the non-UK born as a proportion of the total resident population within a given area, the highest increase (a 211.6% increase from 1.4% in 2001 to 4.5% in 2011) took place again in Merthyr Tydfil. The area with the lowest percentage change in the share of the foreign-born population within the resident population was Conwy, with the non-UK born share increasing by 30.8% (from 3.3% in 2001 to 4.3% in 2011).
Figure 5
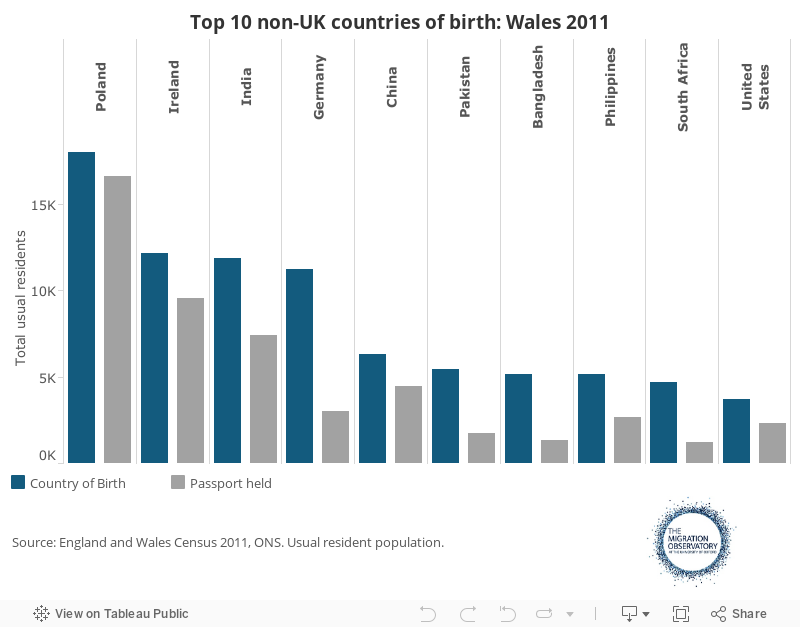
Residents born in Poland represent the most numerous non-UK born group in Wales (18,023 residents), followed by residents born in Ireland, India, Germany and China
As shown in Figure 6, residents born in Poland represent the most numerous non-UK born group in Wales with 18,023 residents, amounting to 10.7% of Wales’ non-UK born population (and 0.6% of the total population of Wales). Poland has become the top country of birth for non-UK born residents due to an increase in the Polish-born since 2001; in fact, the number of Polish born residents in Wales increased by 1,163% from 1,427 in 2001 to 18,023 in 2011. In terms of the most numerous non-UK countries of birth, Poland is followed by residents born in Ireland (12,175), India (11,874), Germany (11,208) and China (6,296). Within the top 10 countries of birth for the non-UK born population were also Pakistan, Bangladesh, the Philippines, South Africa and the United States of America. The resident population born in these 10 countries represents half (49.9%) of the total foreign-born population of Wales.
In terms of passports held, Poland also comes out in top place for Wales in terms of the number of residents that held only a non-UK passport, with 16,604 residents holding a Polish passport in 2011. This represents 53.5% of all residents with foreign passports only and 3.1% of the total population in Wales. In this category, residents with Irish passports also come second with 9,543 residents and Indian-passport holders come third with 7,408 residents.
Figure 6
Of those residents born in Poland, 84% held a non-UK passport only in 2011 (83% holding a Polish-passport), while 4% held only a UK passport and 12% held no passport. In terms of residents born in India, by comparison, 57% held a non-UK passport only (55% held an Indian-passport) and 42% held a UK passport, while 2% held no passport.
The differences in the relationship between the non-UK born and non-UK passport-holders measures in the cases of Poland and India can be partly explained, on the one hand, by the fact that EU citizens have less need to acquire UK citizenship as they are not subject to immigration controls and on the other, by the historical differences in migration from these countries. In fact, 95% of Polish-born residents living in Wales in 2011 arrived in the UK since 2001 (93% since 2004). Conversely, 35% of Indian-born residents living in Wales in 2011 arrived in the country before 2001; as such they have had more opportunity to become eligible and apply for British citizenship. It is also important to note that many within the German-born category will be children of British military personnel stationed in Germany at the time of their birth, who will thus have British citizenship.
As a percentage of the non-UK born within each area of Wales, the Polish-born group was the least evenly distributed among the top 5 foreign-born groups
It is important to note that the top non-UK born groups were not evenly distributed across Wales. For example, while Cardiff’s residents represent 11.3% of the population of Wales, its Indian-born residents accounted for 39.6% of all Indian-born residents of Wales. Conversely, the German-born group’s distribution, for example, followed more closely the overall population distribution within Wales.
Figure 7
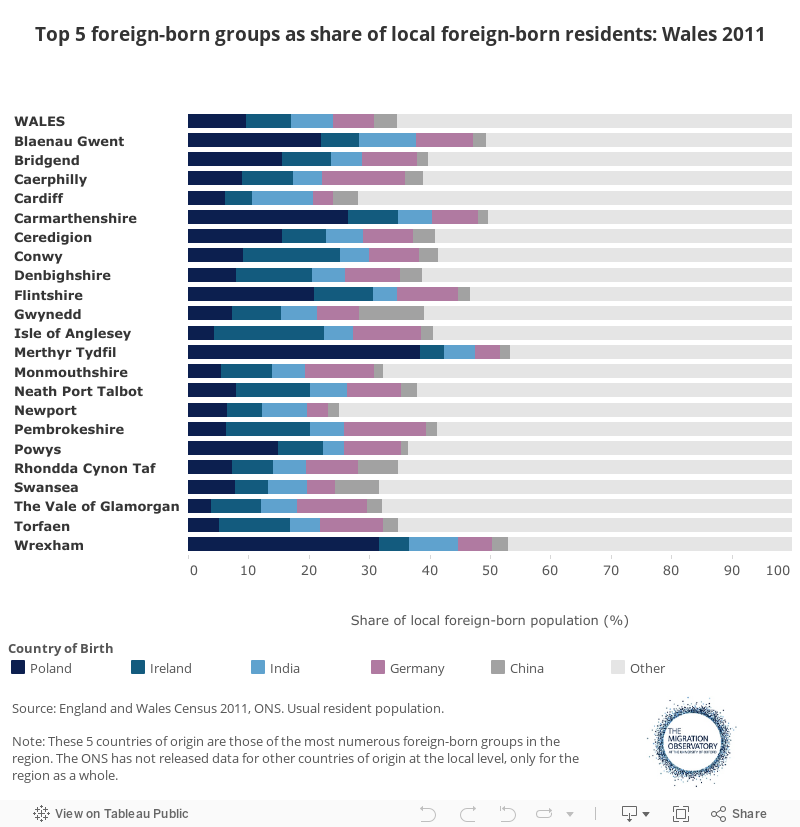
Moreover, the top 5 non-UK born groups represented differing percentages of the total non-UK born population in different areas of Wales (see Figure 7). As a share of the foreign-born within each area of Wales, the Polish-born group was the least evenly distributed among the top 5 foreign-born groups. While Polish-born residents accounted for 10.7% of the foreign-born population of Wales, in Merthyr Tydfil, this stood at 38.5%, the highest in Wales. At the same time, residents born in Poland represented the lowest proportion of non-UK born residents in the Vale of Glamorgan unitary authority (3.8%). On the other hand, the Indian-born population was relatively more evenly distributed in terms of its share of the local foreign-born population. While this foreign-born group accounts for 7.1% of all the non-UK born residents of Wales, it represents the highest share of local foreign-born in Cardiff (10.2%), while the lowest in Powys (3.4%)
In terms of main spoken language, 84,436 residents of Wales (2.9% of total population) spoke a language other than English or Welsh as their main language in 2011
There were 84,436 residents of Wales who spoke a language other than English or Welsh as their main language in 2011. This represents 2.9% of the total resident population aged 3 and above. In terms of main spoken language, the census data do not separate between English and Welsh in Wales. However, the census also asked about Welsh language skills. This shows that 19% of Welsh residents could speak Welsh; this is 23% for those born in Wales and 8% for those born elsewhere. However, further data for main language or language skills is not currently available by country of birth.
Within those residents reporting other than English or Welsh as their main language, the most commonly spoken language was Polish, spoken by 20% of those who mainly used a language other than English or Welsh. This was followed by Chinese languages (Cantonese, Mandarin and all other Chinese languages, 10%), Arabic (8%) and Bengali (with Sylheti and Chatgaya, 6%), to name those languages spoken by 5 or more per cent of those who did not speak English or Welsh as their main language. Table 2 shows the top 15 languages (or language groups) in Wales in 2011. These languages (or language groups) account for 69% of all the languages spoken by those not using English or Welsh as their main spoken language.
Table 2 – Main spoken language if not English or Welsh: Wales 2011
| Usual residents | Share (%)* | |
|---|---|---|
| Polish | 17001 | 20.1% |
| Chinese languages(1) | 8103 | 9.6% |
| Arabic | 6800 | 8.1% |
| Bengali(2) | 5207 | 6.2% |
| Tagalog/Filipino | 2749 | 3.3% |
| Portuguese | 2451 | 2.9% |
| Urdu | 2350 | 2.8% |
| French | 2073 | 2.5% |
| German | 2050 | 2.4% |
| Italian | 1694 | 2% |
| Spanish | 1668 | 2% |
| Panjabi | 1651 | 2% |
| Somali | 1531 | 1.8% |
| Malayalam | 1472 | 1.7% |
| Slovak | 1419 | 1.7% |
| Other | 26217 | 31.1% |
| Total | 84436 | 100% |
Among those Welsh residents of who did not select English or Welsh as their main spoken language in 2011, 77% reported speaking English or Welsh very well or well (39% and 38% respectively). At the same time, 19% reported not being able to speak English well, while 4% reported they couldn’t speak English at all (0.5% and 0.1% of all residents above the age of 3 respectively). Compared to the whole of England and Wales, foreign-born residents in Wales reported a slightly lower English proficiency. While 77% of those who did not speak English as their main language in Wales stated they could speak English or Welsh very well or well, for England and Wales as a whole, this was 79% (in England, this measure denotes proficiency in English only).
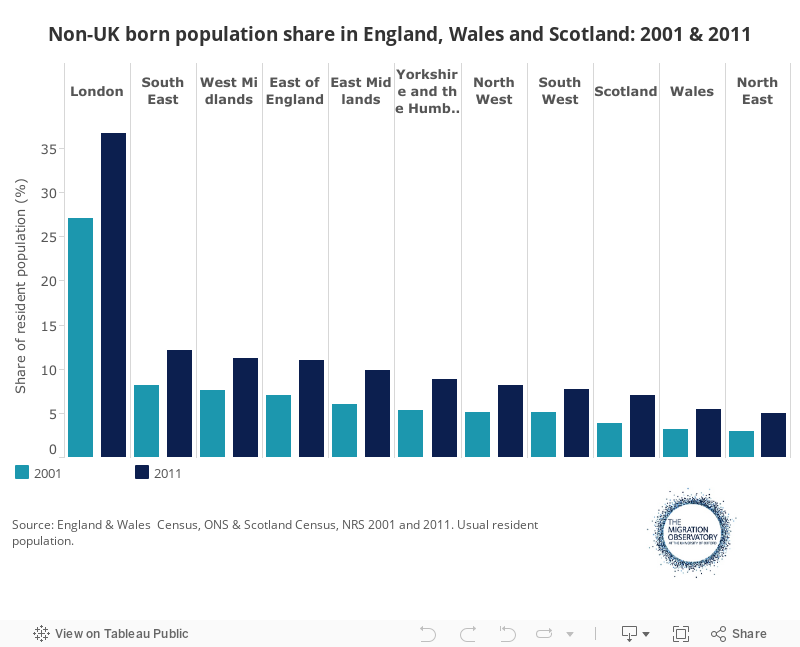
In both 2001 and 2011, Wales had a smaller number and population share of non-UK born residents than all the regions of England except the North East as well as than Scotland
In terms of a comparison with the regions of the UK, Wales had a smaller foreign-born population than all English regions but the North East as well as than Scotland, in both 2001 and 2011 (see Figure 8). In 2011, the number of foreign-born residents in Wales (167,871) was about 18 times lower than London’s 3 million foreign-born (the region with the highest number of foreign-born residents in England and Wales), and only about 1.3 times higher than the 128,573 foreign-born residents in the North East, the region with the lowest non-UK born population.
In terms of the share of the foreign-born population within the total regional population, in both census years Wales also had a smaller share (5.5%) than all English regions with the exception of the North East as well as than Scotland (see Figure 9). In 2011, the region with the highest proportion of non-UK born residents was London (37%), while the region with the lowest share was the North East (5%).
Figure 8
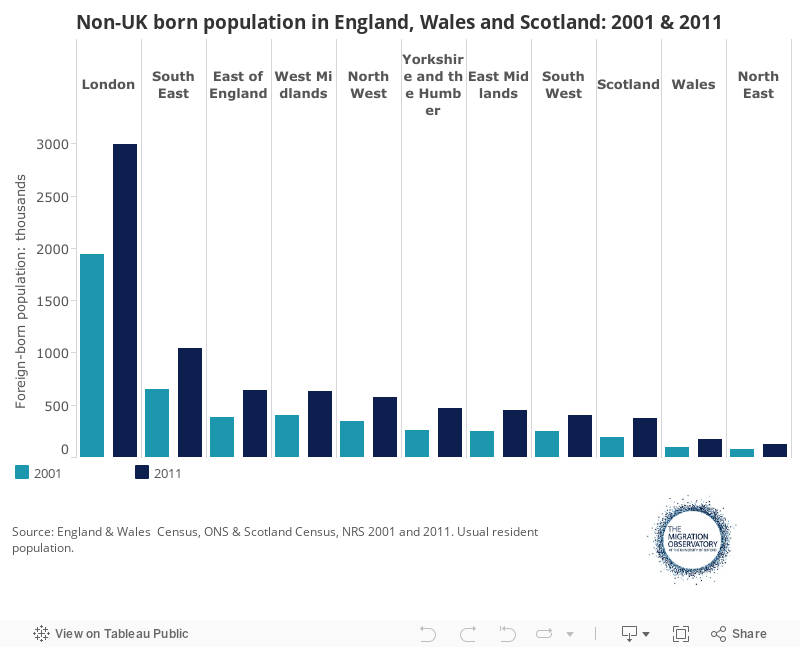
Figure 9
Evidence gaps and limitations
There are two main limitations of the census. Firstly, it is typically only conducted every 10 years. Therefore, other sources of information are important in order to update the information between censuses. Secondly, there are only a limited number of questions included in the census. Therefore, sources of information on the broader characteristics of the population can also complement the census information.
While the census aims to include the entire population, it does have a certain margin of error. For England and Wales as a whole, the relative confidence interval at the 95% confidence level published by the ONS was 0.15% (83,000 people more or less than the estimate). To give an example at the more local level, for Cardiff’s usually resident population, the relative confidence interval at the 95% level was 1.76%, suggesting a 95% probability that the true value of the population lies somewhere between 352,181 and 339,999 persons (ONS, 2012). Specific confidence intervals are not currently available for census data relating to country of birth.
References
- Office for National Statistics. “Detailed country of birth and nationality analysis from the 2011 Census of England and Wales.” London, May 2013.
- Office for National Statistics. “Confidence Intervals for the 2011 Census.” London, December 2012.
Related material
- Migratio Observatory briefing – Who Counts as a Migrant? Definitions and their Consequences
- Migration Observatory briefing – Geographical Distribution and Characteristics of Long-Term International Flows to the UK
- Migration Observatory briefing – Migrants in the UK: An Overview
Further information
-
Media Coverage
-
Daily Mail (08 Jun 2016)
Two ordinary voters who spoke up for Britain while the politicians bickered -
BBC Radio 4 (07 Jun 2016)
BBC Radio 4 Today cites our Wales Census profile
-
Daily Mail (08 Jun 2016)