
This briefing examines settlement, also known as indefinite leave to remain (ILR), which is when a migrant is granted the right to live indefinitely in the UK. It looks at how many non-EU migrants settle in the UK and discusses the post-Brexit EU Settlement Scheme.
-
Key Points
- The majority of non-EU migrants who received an initial visa between 2005 and 2019 did not acquire settlement (ILR) in the UK, although there are signs that migrants became more likely to remain in the UK long term after 2020
More… - Just over 30% of people granted settlement in 2024 were initially granted family unification visas, reflecting the fact that most people who migrate for family reasons stay in the UK long-term
More… - Over half of all migrants granted settlement in 2024 had been in the UK on a temporary visa for five or six years, and around 15% took ten years or more
More… - The number of settlement grants in a given year is influenced by both long-term net migration levels and changes in how applications are processed
More… - The cost of an application for settlement (ILR) was £3,029 in April 2025
More… - By the end of September 2025, 1.4 million EU citizens held pre-settled status under the EU Settlement Scheme for people living in the UK before Brexit, while an estimated 4.4m held permanent, settled status
More…
- The majority of non-EU migrants who received an initial visa between 2005 and 2019 did not acquire settlement (ILR) in the UK, although there are signs that migrants became more likely to remain in the UK long term after 2020
-
Understanding the policy
Most migrants enter the UK on temporary visas that come with various restrictions (e.g. they may only be allowed to do certain activities and are not usually able to access welfare benefits). ... Click to read more.After a few years, people on certain types of temporary visas can apply for permanent status, also known as settlement, indefinite leave to remain (ILR), or ‘settled status’.
Settlement is usually permanent, although it is possible to lose it in some circumstances. People granted settlement are free to work or study in the UK; access state benefits; use the NHS; sponsor an immigration application, such as that of a spouse wishing to join them; and register their UK-born child as a British citizen.
A grant of settlement is not the same as being given citizenship. British citizenship entitles the recipient to a British passport and to vote in general elections, while settlement does not.
Before the end of free movement at the end of 2020, EU citizens did not need to apply for settlement to stay long-term in the UK. However, since 1 January 2021, EU citizens have been subject to the same immigration rules as non-EU citizens and thus to live permanently in the UK require either settlement, which, if they arrived before 1 January 202,1 they can apply for under the EU Settlement Scheme (EUSS) – or a temporary status granted by the government (see below). This briefing refers to the ‘EU’, but the same rules on movement and settlement apply to Switzerland and the European Economic Area, which includes the EU countries plus Iceland, Liechtenstein, and Norway. Irish citizens are allowed to live and work in the UK through separate arrangements that were not affected by Brexit, and are considered to be settled from the day they arrive in the UK.
To be eligible for settlement, non-UK citizens (including EU citizens arriving in the UK from 1 January 2021) must have lived in the UK on a qualifying temporary visa for a certain period of time, usually five years. Time spent on some visas, such as student visas or intracompany transfer visas, does not count towards the residence requirement for settlement. A person may also qualify for settlement if they have lived in the UK legally for a continuous period of 10 years – a route known as ‘Long Residence’.
To receive settlement, most migrants will also have to pass a ‘Life in the UK’ test and demonstrate sufficient knowledge of the English language.
In November 2025, the government announced its intention to tighten the eligibility requirements for settlement. Under its ‘earned settlement’ proposals – which, at the time of writing, have not been implemented in law – the default qualifying period would increase from five to 10 years. From this default period, migrants would face longer or shorter waits depending on their characteristics, such as their earnings or English language proficiency. In addition, the ‘Long Residence’ rules would be abolished. For an in-depth discussion of the earned settlement proposals, see the Migration Observatory commentary, Changes to settlement: what do they mean?
EU citizens (and their family members) who arrived in the UK before the end of 2020 are eligible for ‘settled status’ under EUSS if they can show they have lived in the UK for a continuous period of at least five years. If the applicant has lived in the UK for less than five years, they will usually receive ‘pre-settled status’, which allows the applicant to receive settled status once they have accrued the necessary five years’ residence.
-
Understanding the evidence
Data on settlement come from the Home Office, as part of its Immigration System Statistics Quarterly Release. These data take account of the appeal and reconsideration of cases. ... Click to read more.This briefing relies primarily on Home Office data on the visa status of non-EU migrants over time, also known as ‘Migrant Journey’ data. This information provides the immigration status of an annual cohort of new entrants at the end of each calendar year after their arrival, and is used to calculate the proportions of those granted a visa in a given year who have received a grant of settlement (or citizenship, which requires settlement) in subsequent years. This briefing groups people who hold either settlement or citizenship together, because a grant of citizenship requires settlement. Data on people issued visas in each route also include their dependant family members. Thus, for example, dependants of work migrants will generally be included in the ‘work’ settlement figures, not in ‘family’.
Until the end of 2020, EU citizens did not require visas and so were not included in the main settlement figures (although there are separate statistics on the EU Settlement Scheme and on permanent residence documents issued).
There are no visas for the purpose of seeking asylum. However, people granted settlement on the basis of asylum can be separately identified by looking at whether they had an asylum-related type of leave immediately prior to being granted settlement.
How many migrants get settlement?
The precise number of non-EU citizens with settlement, also known as indefinite leave to remain (ILR), is not known, but Migration Observatory estimates suggest it was likely to have been between 620,000 and 820,000 at the end of 2024. This does not include people who, after acquiring settlement, became British citizens. For more information, see the commentary, How many migrants in the UK have settlement?
The majority of non-EU migrants who received an initial visa during the past two decades did not go on to acquire settlement. Indeed, no cohort receiving visas between 2005 and 2014 had a settlement rate above 32% in 2024, at least 10 years after their initial visa was issued—in other words, around 70% no longer held a valid visa and were expected to have left the country (Figure 1).
There are significant differences in settlement rates by the type of visa on which someone comes to the UK. At the end of 2024, at least 77% of family migrants who received an initial family visa between 2005 and 2018 had received a grant of settlement, considerably higher than the settlement rates of study and work migrants over the same period (no higher than 17% and 27% respectively).
Figure 1

Settlement rates are expected to increase in the second half of the decade, however. An early indication is the share of non-EU arrivals who still held a valid visa after two years. Among migrants who received their first visa in 2022, 82% had leave to remain at the end of 2024, the highest share of any cohort in the past 20 years (Figure 2). This is the result of several factors, including a change in the types of visas granted (e.g., more work visa grants are for long-term routes rather than temporary ones) and changes in migrant behaviour (e.g., an increasing number of international students are switching onto work routes after their studies).
Figure 2

Which groups of migrants received settlement in 2024?
Figure 3 shows the number and share of migrants granted settlement in 2024 by their initial visa type, and the visa type they held at the point they were granted settlement. Of the 167,000 migrants granted settlement in 2024, 31% initially entered the UK on a family visa, and a further 30% on a work visa. These were also the most common types of visa held by migrants immediately before their settlement grant.
Figure 3

Family makes up a relatively small share of visas granted, but people who initially received a family visa were the most likely to be granted settlement in 2024 (see Figure 1). By contrast, the share of settlement grants that went to migrants issued an initial work visa reflects the size of this migration route—between 2017 and 2019, around 30% of non-EU immigration to the UK was for this reason. This was the second most common reason, behind study (50%).
However, the share of settlement grants for migrants who initially entered the UK on study visas was only 11% in 2024. This is a smaller share than in previous years due to policy changes in the early 2010s that made it harder for international students to stay in the UK after graduation to work, mostly notably the closure of the post-study work route in 2012. A new post-study work route—the graduate route—was introduced in July 2021, but its impact will not be seen for several years, because the time spent on study and post-study work routes does not count towards settlement. For more information about the international students and settlement, see the Migration Observatory briefing, International student migration to the UK, and the Migration Observatory commentary, International students entering the UK labour market.
Among migrants granted settlement in 2024, most of those who came to the UK on an initial family or work visa, or for the purpose of claiming asylum, acquired settlement via the same route (Figure 4).
Figure 4

How long do migrants spend on visas before acquiring settlement?
Looking at all non-EU migrants granted settlement in 2024, over half received their initial visa in 2018 or 2019 (Figure 5). Just over 15% of people (25,600) took ten years or more to gain settlement (i.e., received their initial visa in 2014 or earlier).
A little under 10% (14,700) received their initial visa or grant of leave in the same year they were granted settlement or citizenship (i.e., in 2024). The large majority of the latter group were granted settlement upon arrival in the UK, known as ‘indefinite leave to enter’ (ILE). This share was unusually high in 2024, in part because many of the people relocated from Afghanistan that year were given immediate settlement. Among those eligible for ILE are people who previously had settlement and are returning to the UK after an absence of more than two years.
The time it takes for a migrant to be granted settlement is highly dependent on the type of visa on which they first came to the UK (Figure 5). Whereas around 80% of family and work migrants granted settlement in 2024 received their initial visa within the prior six years, the most common duration for those who initially arrived on a student visa was 10 years.
Figure 5

In recent years, an increasing share of family unification migrants (i.e., partners and children joining British citizens or settled residents in the UK) have been on a ten-year route to settlement. This is most common where migrants do not qualify under any of the mainstream immigration routes, but make a successful claim to remain in the UK under human rights rules. More information about ten-year routes to settlement can be found in the Migration Observatory briefing, Migrants on ten-year routes to settlement in the UK.
Which factors affect the number of settlement grants?
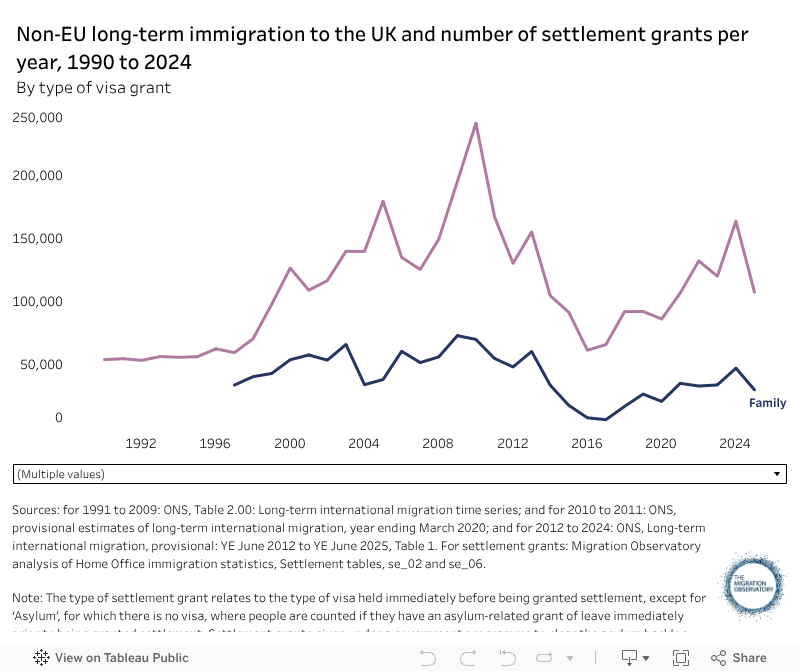
The number of settlement grants in a given year is not a simple reflection of immigration levels a few years earlier—settlement policy can also play a role. For example, the fall in settlement grants between 2010 and 2016, and the steady increase from 2017 onwards, owed in part to a 2012 policy change that lengthened the residence requirement for family migrants from two to five years and thus delayed some settlement grants that would otherwise have been made in earlier years (Figure 6).
In November 2025, the government announced its intention to tighten the eligibility requirements for settlement. Under its plans – which, at the time of writing, have not been implemented in law – the default waiting time would increase from 5 to 10 years. From this default period, migrants would wait for longer or shorter periods depending on their characteristics, such as their earnings or English language proficiency. If implemented, these changes are expected to lead to a reduction and delay in settlement grants over the next few years. For further information, see the Migration Observatory commentary, Changes to settlement: what do they mean?
Figure 6
Another factor that influences the number of settlement decisions is the allocation of resources within the Home Office. For example, in 2010, there were around 240,000 grants of settlement, the highest level since comparable records began in 1960. This was an outlier, driven primarily by a government programme to clear an asylum backlog by granting settlement to some pending asylum applicants.
How much does settlement cost?
In 2003, a fee of £155 was introduced for an application for indefinite leave to remain. Since then, the application fee has been increased several times, reaching £3,029 in April 2025 (Figure 7). This fee also applies to each dependant (i.e., partner and any children) of a non-EU citizen applying for settlement—therefore, a family of four who are all applying for settlement would pay £12,120 in application fees. These fees must be paid at the point of application, and are not refunded if the application is refused.
Since 2016, the government has published the estimated actual cost of processing immigration applications. The estimated cost to the government of processing an application for settlement in April 2025 was £523, 17% of the fee charged. The total cost of immigration fees is higher if one includes prior immigration applications and other fees that must be paid before a person can apply for settlement, such as the Immigration Health Surcharge.
The government uses the additional revenue from immigration fees to subsidise the cost of the UK’s immigration system, including the cost of processing applications that do not have fees. For more information, see the Migration Observatory Q&A, Immigration fees in the UK.
Figure 7

For the government, granting settlement can have wider fiscal costs. Analysis by the Migration Advisory Committee shows that migrants who have lived in the UK longer are more likely to have a negative fiscal impact—that is, their use of public services and any benefits they receive costs more than their tax contributions. This effect is driven primarily by people ageing, because older people are less likely to work and incur higher spending on pensions and healthcare. In addition, the fiscal costs of lower-income migrants will often increase after receiving settlement because they become eligible for welfare benefits.
The amount paid in benefits to people with settlement is unclear because figures published by the Department for Work and Pensions likely include individuals who now hold British citizenship (see Evidence Gaps & Limitations).
How many EU citizens have applied to the EU Settlement Scheme?
Prior to the UK’s departure from the European Union on 1 January 2021, EU citizens and their families had the right to live, work and access services in the UK upon arrival, and they did not need to apply for settlement to stay long-term. The government’s EU Settlement Scheme (EUSS) was introduced to maintain these rights and provide a route to settlement for those who arrived before the end of 2020. For more information, see the Migration Observatory briefing, EU Migration to and from the UK.
By the end of September 2025, 6.4 million people had applied to EUSS. Of these, 5.8 million applicants were EU citizens, higher than the official estimate of approximately 4 million EU citizens living in the UK in 2021. This difference is primarily a result of two factors: some EU citizens will have applied to EUSS but subsequently left the UK, and official statistics may underestimate the size of the EU migrant population. Among the 5.8 million EU citizens who had applied to EUSS, an estimated 4.4 million had been granted settled status by the end of September 2025, and a further 1.4 million held pre-settled status (Figure 9).
Figure 8

Pre-settled status – designed for anyone who had been living in the UK for less than five years at the end of 2020 – has more restrictive conditions than settled status. For example, whereas settled status holders can claim benefits regardless of their situation, pre-settled status holders must also meet certain eligibility criteria, such as being in work or being able to prove they are unable to meet their most basic needs.
In general, pre-settled status holders can upgrade to settled status once they have lived in the UK for five years, so long as they haven’t been absent from the UK for more than 2.5 years of that five-year period. In theory, pre-settled status expires if the holder spends long periods of time outside the UK (2 consecutive years before May 2024, or 5 consecutive years for later absences). However, there are no data on whether the Home Office has begun removing pre-settled status from people with long absences from the UK. For more discussion of the issues facing pre-settled status holders, see the Migration Observatory commentary, Outstanding issues facing the EU Settlement Scheme.
Evidence Gaps and Limitations
The impacts of policy changes on settlement are often difficult to determine. It takes several years for policy changes to work their way through the system, since changes are generally introduced only for newly arriving people. Data on how migrants’ economic activities change after settlement are very limited, because most official surveys do not ask whether respondents have ILR, and the government has not yet linked Home Office and HMRC or DWP administrative records to examine outcomes of settled residents.
The Department for Work and Pensions publishes data on Universal Credit (UC) recipients by immigration status. In the dataset, immigration status is recorded when an individual makes an initial claim or when their circumstances change. However, the DWP is not usually notified if somebody with settlement acquires British citizenship. As a result, the UC figures for settlement will also include people with citizenship and thus will be higher than in reality.
Acknowledgments
With thanks to Nicolas Rollason for providing valuable feedback on the 2019 version of this briefing, and CJ McKinney for help updating the 2020 version.