
This briefing summarises key statistics from the 2011 Census for London and its boroughs. The briefing provides information about population levels, the number, population share, age and gender of foreign-born residents, as well as countries of origin and main languages. Finally, the briefing compares London to other regions of England and Wales and with the results of the 2001 Census.
-
Key Points
- In 2011, the total usual resident population of London stood at just over 8 million, 37% of which (3 million residents) had been born outside of the UK. London’s non-UK born population increased by 54% since 2001, accounting for 105% of the total population increase, as the UK-born population decreased in the decade.
More… - In 2011, 46% of the non-UK born population held a UK passport, and 52% held only a non-UK passport. The rest (2%) held no passport.
More… - The borough of Brent had the highest number (171,472) as well as the population share (55%) of non-UK born residents out of all London boroughs.
More… - Between 2001 and 2011, the non-UK born population grew the most in Newham (72,285 additional residents), but the biggest percentage increase took place in Barking and Dagenham (205% increase).
More… - Residents born in India represent the most numerous non-UK born group in London (262,247 residents), followed by residents born in Poland, Ireland, Nigeria and Pakistan.
More… - London had the highest number as well as proportion of non-UK born residents out of all the regions of England and Wales in both 2001 and 2011.
More…
- In 2011, the total usual resident population of London stood at just over 8 million, 37% of which (3 million residents) had been born outside of the UK. London’s non-UK born population increased by 54% since 2001, accounting for 105% of the total population increase, as the UK-born population decreased in the decade.
-
Understanding the Evidence
The census is the most complete source of information about the population. It is particularly useful for obtaining population estimates for small geographical areas and information on the characteristics of such population. Other sources of information on population characteristics in the UK such as the Labour Force Survey have large margins of error at the local level, because they are based on survey data and rely on a limited number of observations at the local level. The census is a count of people and households and efforts are made in order to include everyone.
The latest UK censuses were conducted during 2011. In England and Wales the census was conducted by the Office for National Statistics (ONS) and in Scotland the census was conducted by the National Records of Scotland, while in Northern Ireland the census was conducted by the Northern Ireland Statistics and Research Agency. There are different release dates for the data in these censuses (including the migration related data). Therefore, the current briefing uses only information from the ONS 2011 Census releases for England and Wales.
When analysing the nature of migration, defining who counts as a migrant is of crucial importance. Yet there is no consensus on a single definition of a ‘migrant’. Different datasets—and analyses from these datasets—use a variety of definitions of ‘migrant,’ including (1) country of birth, (2) nationality, (3) passports held, (4) length of stay, (5) reason for migration and (6) being subject to immigration controls. For example, people who are foreign-born are not all foreign nationals; likewise, some foreign nationals may have lived in the UK for decades while others reside in the UK for only a year. Perhaps most importantly, not all foreign-born UK residents are subject to immigration control. Some are the children born abroad of UK national parent(s)–e.g. service personnel. Others are long-term residents who have acquired British citizenship. EEA nationals are also not subject to immigration control, yet are often considered migrants in public debate and in ONS net migration counts. This includes EEA nationals born outside the EEA.
The data analysed in this briefing are based mainly on the census statistics for country of birth as well as passports held, not current nationality. The census collected data on passports held, and this can be used as a proxy for nationality; yet nearly 17% of the total usual resident population of England and Wales held no passport in 2011 (ONS, 2013) and data for passports held in not available for 2001, precluding the measure of change over time. When using data on country of birth, it is important to note that many of those included in the foreign-born category will have British citizenship.
The data presented include statistics for usual residents only, unless otherwise specified. Usual residents are defined as anyone in the UK on census day who had stayed or intended to stay in the UK for 12 months or more (or were outside the UK but had a permanent UK address and intended to stay outside the UK for less than 12 months). In terms of countries of birth, data are available for 160 countries as part of regional totals. At the local level, however, data have not been provided for all countries of origin. Instead, the ONS has identified 27 key countries of origin most common at the national level, and all local analyses of the most frequent countries of origin only refer to the most frequent countries out of the 27 key countries of origin. As such, particularly at the local level, there may be other more numerous foreign-born groups that the current census release does not include. However, the totals for each region of origin are available for local areas.
See the Migration Observatory video interview of Peter Stokes, 2011 Census Statistical Design Manager, for further discussion.
In 2011, the total usual resident population of London stood at just over 8 million, 37% of which (3 million residents) had been born outside of the UK. London’s non-UK born population increased by 54% since 2001, accounting for 105% of the total population increase, as the UK-born population decreased in the decade
According to the 2011 Census, the number of usual residents of London stands at 8,173,941 (see Table 1). This total accounts for about 15% of the total resident population of England and Wales in 2011. Of this total, 2,998,264 London residents (36.7% of the total London population) were born outside the UK. This figure rises to 42.2% for Inner London, while dropping to 33.1% for Outer London. Moreover, London concentrates a large proportion (40%) of the entire foreign-born population of England and Wales.
Between 2001 and 2011, London’s total population increased by 14%, by about 1 million residents. However, the UK-born population in London actually declined, by 1% (about 50,000 residents). The foreign-born population grew by an estimated 1,055,360 residents, representing a 54% increase since 2001. As such, the growth in the non-UK born population accounted for 105% of the total growth of the London population.
Table 1 – Key census statistics for London
| 2001 | 2011 | Change (%) | |
|---|---|---|---|
| Total usual resident population | 7172091 | 8173941 | 14% |
| UK-born resident population | 5229187 | 5175677 | -1% |
| Non-UK born resident population | 1942904 | 2998264 | 54% |
| Non-UK born share of region's population | 27.1% | 36.7% | +35.4% |
| Share of non-UK born of England and Wales | 41.8% | 40% | -4.3% |
| Non-UK passport holders | 1714606 | ||
| Non-UK passport holder share of region's population | 20.9% |
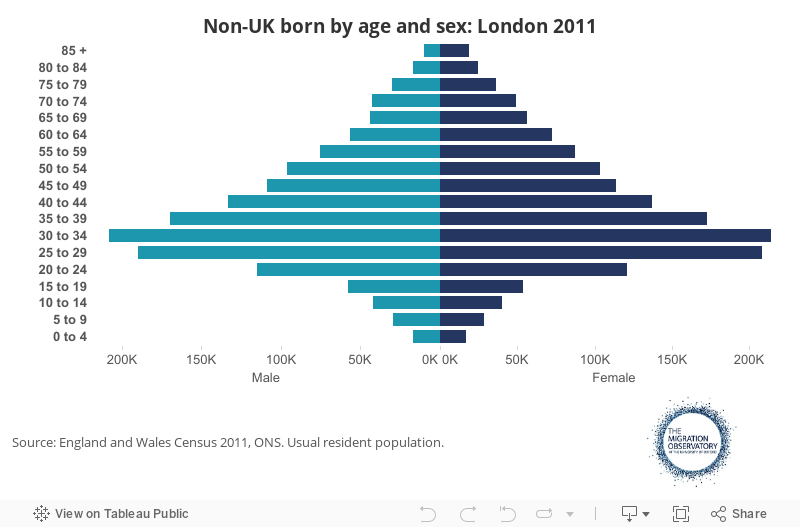
A slight majority (52%) of London’s non-UK born residents were women, and nearly half (47%) were aged between 20 and 39 years of age
Of the estimated 2,998,264 non-UK born residents in 2011, 48% were male and 52% were female (see Figure 1). In terms of age, the most common age group was that of 30 to 34 years of age, accounting for 14% of the total non-UK born population. Indeed, 47% of all foreign-born residents of London were aged between 20 and 39 years of age. For the UK-born population, in contrast, this was 29%. While there were more women in the foreign-born population overall, this was only the case for those aged 20 years or older. For those younger than 19, there were more men (51%) in the foreign-born population. For the rest of the age-groups, women remained more numerous, and this got more pronounced as the population’s age increased.
Figure 1
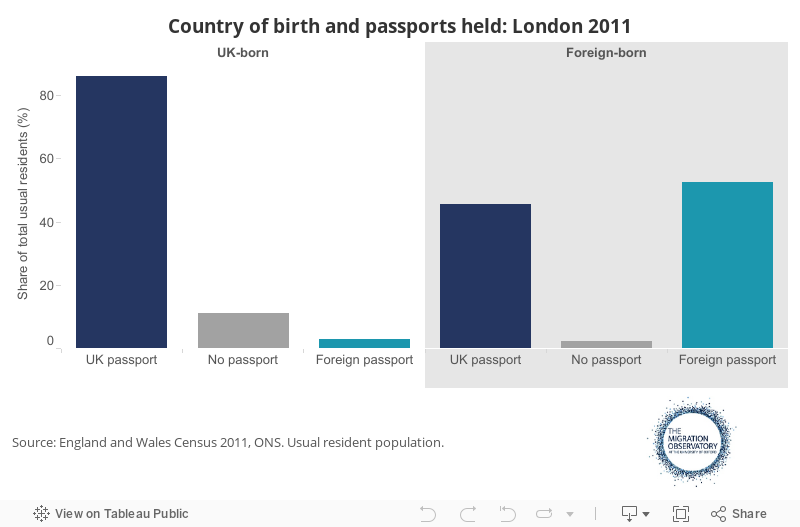
In 2011, 46% of the non-UK born population held a UK passport, and 52% held only a non-UK passport. The rest (2%) held no passport
In 2011, 71% of London’s population held a UK passport and 21% (1,714,606 residents) held a non-UK passport only (see Table 1). Only 8% of London’s usual residents held no passport in 2011. It is important to note that for residents with dual passports, priority was given to UK passports and then Irish passports in the census data collection process. Thus, respondents with both a UK and a non-UK passport are included as having a UK passport. In terms of the non-UK born population, 45.5% of the non-UK born population (1,362,826 residents) held a UK passport, while 52.4% (1,569,548 residents) held only a non-UK passport (see Figure 2). Only 2.2% of the foreign-born population (65,893 residents) held no passport.
Figure 2
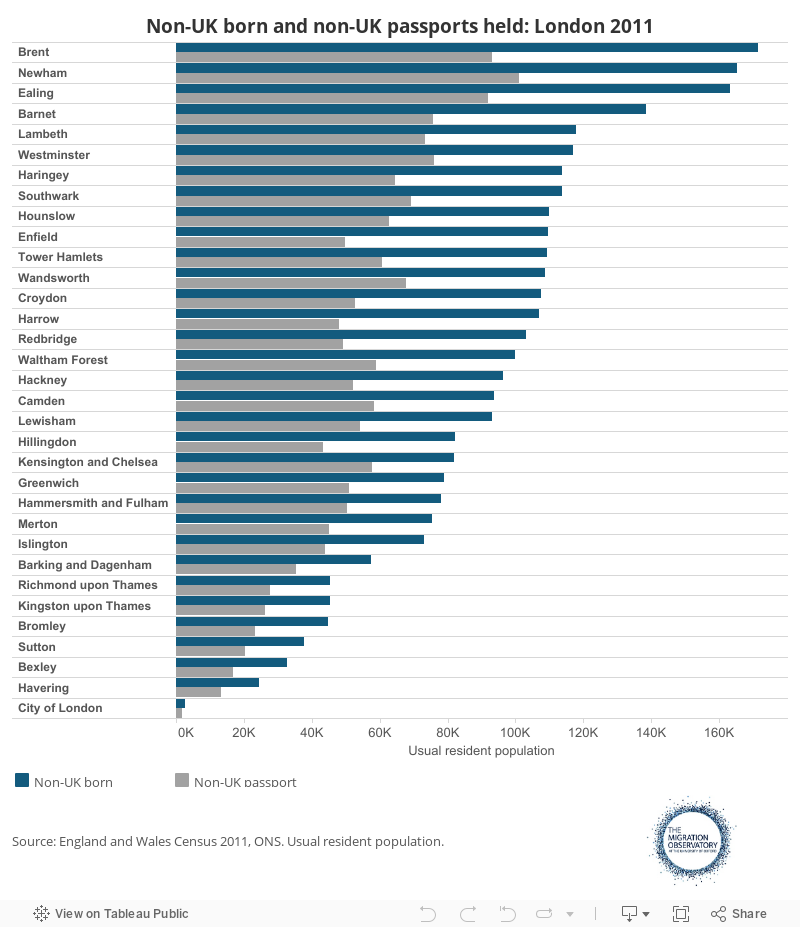
The borough of Brent had the highest number (171,472) as well as the population share (55%) of non-UK born residents out of all London boroughs
There were 1,364,178 and 1,634,086 non-UK born residents living in Inner and Outer London respectively in 2011. In Inner London, the borough with the largest number of foreign-born residents was Newham with 165,424 foreign-born residents (5.5% of all London foreign-born residents). In Outer London, the borough with the largest foreign-born population was Brent, with foreign-born residents amounting to 171,427 persons (5.7% of all London foreign-born residents). The borough of Brent not only had the largest non-UK born population within London (see Figure 3), it also had the highest percentage (55%) of foreign-born residents within the local population in 2011.
Conversely, the borough with the lowest number of non-UK born residents was the City of London. However, the City of London’s total population is small relative to other London boroughs, and in terms of population share, its non-UK born residents make up 37% of its population. In fact, the population share of non-UK born residents is the lowest for the borough of Havering, with 10% of its population born outside of the UK.
In terms of non-UK passports held, Newham has the highest number of residents with only a non-UK passport out of all the London boroughs, with 101,138 non-UK passport holders accounting for 33% of the local population. In terms of the percentage of the population with a non-UK passport, however, Kensington and Chelsea comes out as the top borough with 36% of local residents having only a foreign passport in 2011. Both of these boroughs are located in Inner London.
The borough with the smallest number of non-UK passport holders was again the City of London; yet this can also be partly attributed to its size, with 24% of its population having a only a non-UK passport in 2011. It is again the borough of Havering that had the lowest population share in this category, with 5.6% of its residents holding only a non-UK passport in 2011.
Figure 3
While there were nearly 3 million people born abroad resident in London in 2011, there were also 68,992 non-UK born short-term residents (defined as staying between 3 and 12 months) living in the capital in the same year, 63% of which resided in Inner London. While Brent had the largest resident non-UK born population, Westminster was the borough with the highest number (6,920) of foreign-born short-term residents, representing 10% of all non-UK born short-term residents living in London in 2011.
Between 2001 and 2011, the non-UK born population grew the most in Newham (72,285 additional residents), but the biggest percentage increase took place in Barking and Dagenham (a 205% increase).
The proportion of non-UK born residents in the London population has increased since 2001 (from 27% to 37%), but London’s share of all foreign-born residents in England and Wales has slightly fallen (from 42% in 2001 to 40% in 2011 (see Table 1). The London-wide increase in the proportion of the resident population born outside of the UK represents a 35% increase in the share that foreign-born residents make up of London’s total usually resident population. This increase was not quite evenly distributed among the different areas of London, however (see Figure 4). While in Inner London, the foreign-born population increased its total population share from 33% in 2001 to 42% in 2011 (25% increase), for Outer London it rose from 22% in 2001 to 33% in 2011 (44% increase).
Figure 4
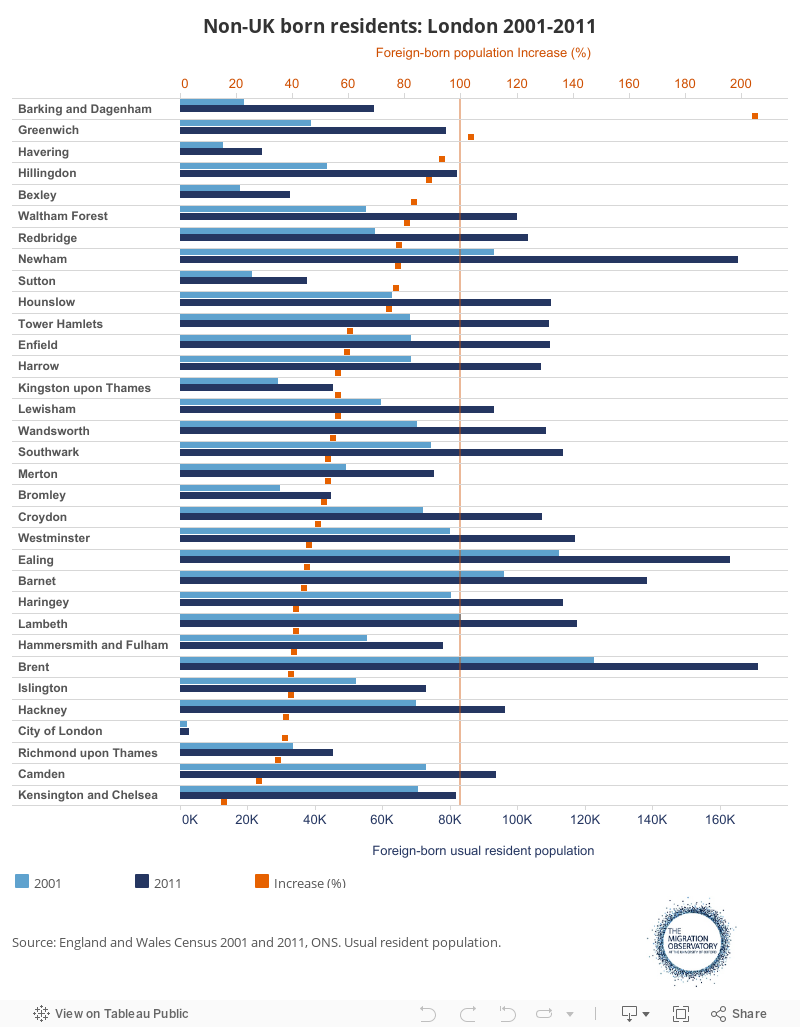
In Inner London, the borough that experienced the sharpest increase in the non-UK born population within the decade was, again, Newham, where the foreign-born population grew by 78% in the 10-year period. Conversely, the Inner London borough that experienced the smallest increase was Kensington and Chelsea (16% increase), and this was the lowest increase for all of London. Outer London had the borough with the greatest increase in the foreign-born population for all of London; this was Barking and Dagenham, where the non-UK born population increased by 205% between 2001 and 2011. Within Outer London, the borough with the lowest foreign-born population growth was Richmond upon Thames, with a 35% increase.
Figure 5
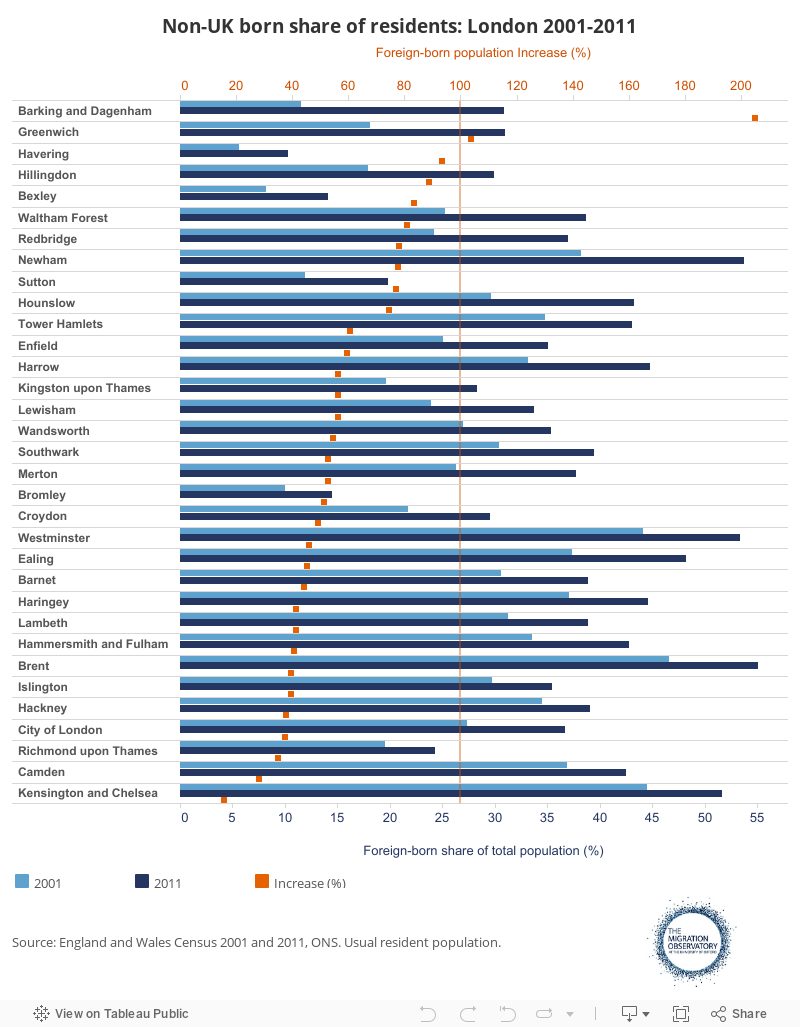
Looking at non-UK born residents as a share of all residents, Newham (Inner London) and Brent (Outer London) come out in the lead, with 54% and 55% of their residents born abroad respectively. Moreover, while the percentage of foreign-born residents increased in all boroughs between 2001 and 2011, it did so at different rates (see Figure 5). Boroughs such as Hackney, Camden and Kensington and Chelsea had the lowest increase in their foreign-born population share between 2001 and 2011; 13%, 15% and 16% respectively. At the same time, the sharpest growth in the foreign-born population share occurred in Barking and Dagenham, where the proportion the non-UK born residents made up of the total population more than doubled (an increase of 170%); this was followed by Havering (83% increase) and Bexley (73% increase).
Residents born in India represent the most numerous non-UK born group in London (262,247 residents), followed by residents born in Poland, Ireland, Nigeria and Pakistan
As shown in Figure 6, usual residents born in India represent the main foreign-born group in London with a total of 262,247 persons born in India living in London in 2011 (8.8% of all foreign-born residents in London). This accounts for 37.8% of all residents that had been born in India usually resident in England and Wales in 2011. People born in Poland represent another major non-UK born group in London with 158,300 persons born in Poland living in London in 2011. This number represents 27% of all residents with Poland as their country of origin living in England and Wales. In total, there were 369,152 residents of London (12.3% of all London foreign-born residents) who were born in countries which joined the EU in 2004 or afterwards. About 44,848 residents of London were born in Romania and this total accounts for 56.3% of all Romanian-born residents in England and Wales. Other important foreign-born groups in London, with more than 100,000 residents, include those born in Ireland (129,807), Nigeria (114,718), Pakistan (112,457) and Bangladesh (109,948).
Figure 6
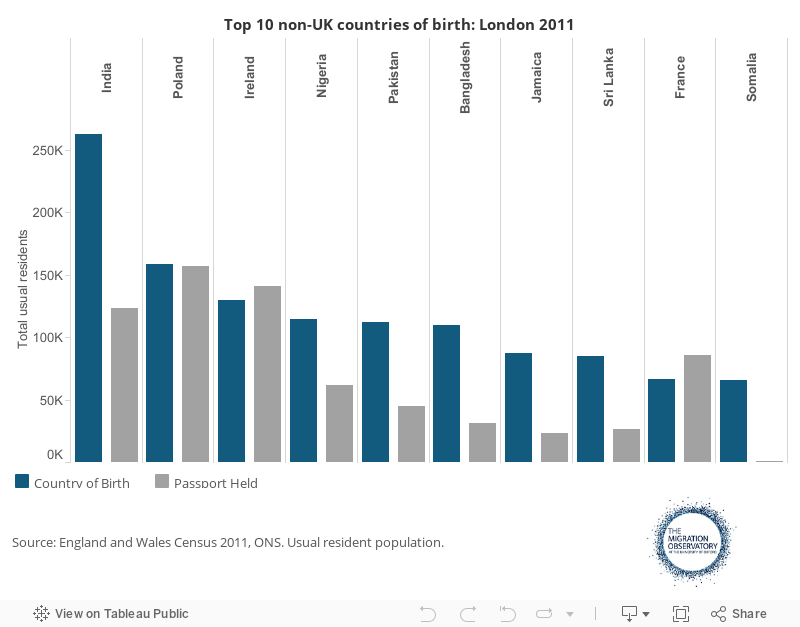
In terms of passports held, residents with Polish passports were the most numerous group (of those residents that held only a non-UK passport) with 156,497 residents holding a Polish passport in 2011. In this category, residents with Irish passports come second with 141,029 residents and Indian-passport holders come third, with 123,011 residents.
In terms of residents born in India, 43% held an Indian passport only, while 53% held a UK passport. Of those residents born in Poland, conversely, 87% held a Polish passport only and 7% held a UK passport. The differences in the relationship between the non-UK born and non-UK passport-holders measures in the case of Poland and India can be partly explained, on the one hand, by the fact that EU citizens have less need to acquire UK citizenship as they are not subject to immigration controls and on the other, by the historical differences in migration from these countries. In fact, 73% of Polish-born residents living in London in 2011 arrived in the UK after the 2004 EU expansion (86% since 2001). Conversely, 52% of Indian-born residents living in London in 2011 arrived in the country before 2001; as such they have had more opportunity to become eligible and apply for British citizenship.
Figure 7
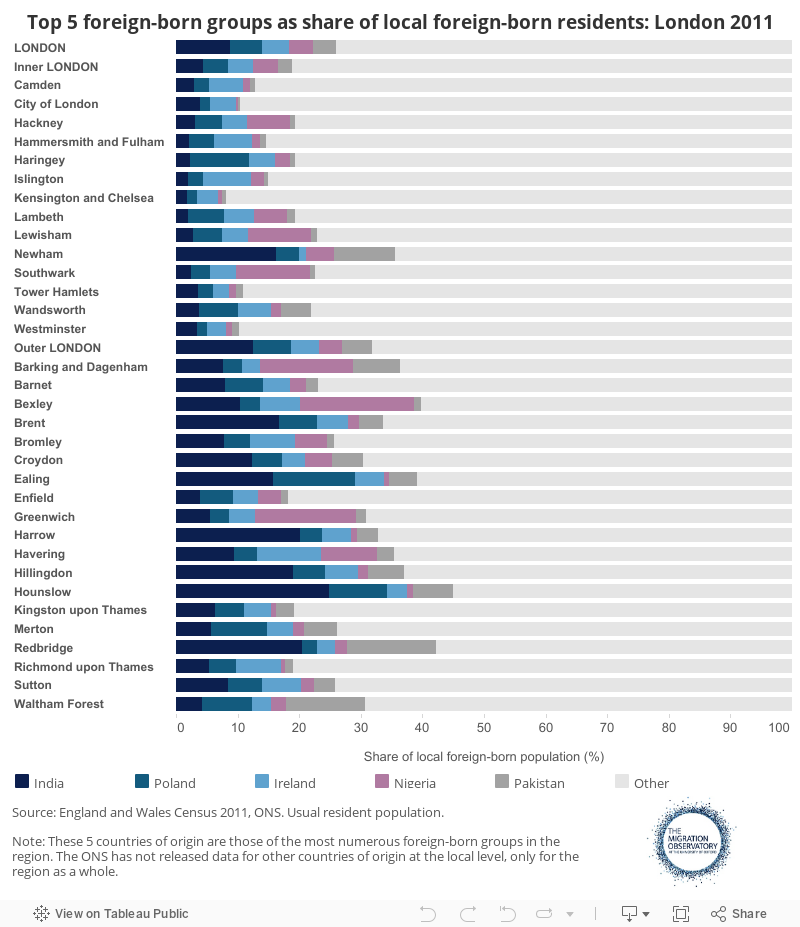
Moreover, the various non-UK born groups were not evenly distributed across London (see Figure 7). Londoners born in Ireland seem to be the most evenly distributed foreign-born group out of the 5 top groups, with their share of the local population standing at between 1% and 10%; this is lowest in Newham, where the Irish-born make up 1.2%, while highest in Havering, where they constitute 10.3% of the residents born outside of the UK. Conversely, residents born in Bangladesh represent the foreign-born group most concentrated in certain boroughs. While in the vast majority of boroughs, Bangladeshi-born residents make up less than 10% of the non-UK born resident population, the lowest being in Brent (0.5%), in Tower Hamlets, residents born in Bangladesh represent 35% of the non-UK born population.
A language other than English is the main language of about 1.7 million residents of London (22% of the London population). London has the highest number of people out of all the regions of England and Wales that do not speak English as their main language
A language other than English is the main language of 1,726,522 million residents of London (limited to those aged 3 over). This represents about 22% of the London population. The share is even higher for Inner London, with a quarter of the usually resident population above the age of 3 not speaking English as their main language, while this is a fifth in Outer London. From those with a main language other than English, close to 9% selected Polish as their main language, followed by Bengali (7%) and Gujarati (6%) (see Table 2). The 15 languages (or language groups) shown in Table 2 represent the main languages of 76% of those who did not select English as their main spoken language.
Table 2 – Main spoken language if not English: London 2011
| Usual residents | Share (%)* | |
|---|---|---|
| Polish | 147816 | 8.6% |
| Bengali(1) | 114267 | 6.6% |
| Gujarati | 101676 | 5.9% |
| French | 84191 | 4.9% |
| Urdu | 78667 | 4.6% |
| Portuguese | 71525 | 4.2% |
| Turkish | 71242 | 4.1% |
| Spanish | 71192 | 4.1% |
| Arabic | 70602 | 4.1% |
| Tamil | 70565 | 4.1% |
| Panjabi | 68525 | 4% |
| Somali | 54852 | 3.2% |
| Chinese languages(2) | 53759 | 3.1% |
| Italian | 49484 | 2.9% |
| Romanian | 39563 | 2.3% |
| Other | 578506 | 33.5% |
| Total | 1726522 | 100% |
London has the highest number of usual residents above the age of 3 out of all the regions of England and Wales that do not use English (English or Welsh in Wales) as their main spoken language, both in real terms and as a proportion of the population. The share of residents that speak another language for England and Wales altogether is 8%, lower than the already mentioned 22% for London. The second region with the highest proportion of residents that speak another language is the West Midlands (7%), while this indicator is lowest in the North East (3%). From those London residents who selected a language other than English as their main language, 44% reported speaking English very well and 37% reported speaking English well. Conversely, 16% reported not speaking English well and 3% reported not speaking English (3.5% and 0.6% of all residents respectively). While 81% of those who did not speak English as their main language in London stated they could speak English very well or well, for England and Wales as a whole, this was 79% (this includes those who did not speak English or Welsh as their main language in Wales).
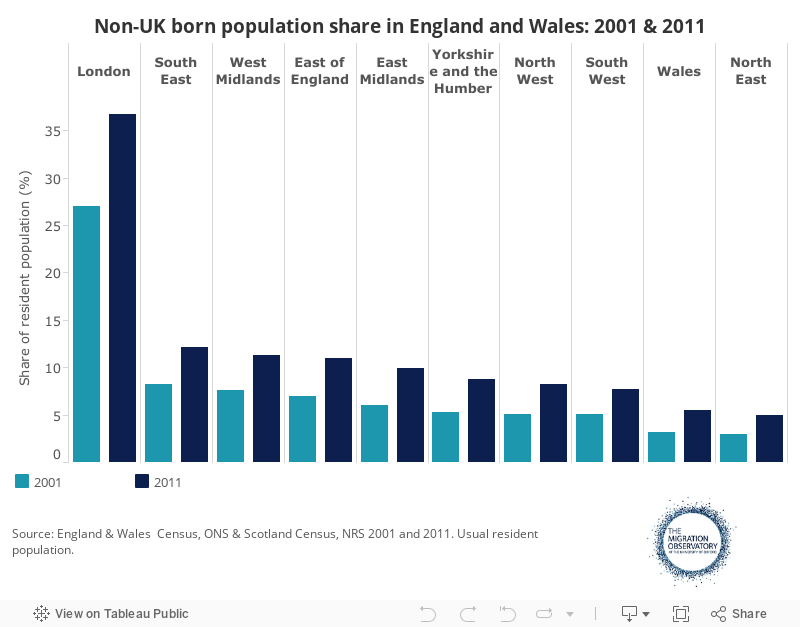
London had the highest number as well as population share of non-UK born residents out of the ten regions of England and Wales in both 2001 and 2011.
London has the highest number of non-UK born residents out of all the regions within the UK, accounting for 40% of the entire foreign-born population of England and Wales. London has maintained this lead since 2001, as shown in Figure 8. London also has the highest share of foreign-born residents in its population; this is also consistent with the 2001 census data (see Figure 9).
Figure 8
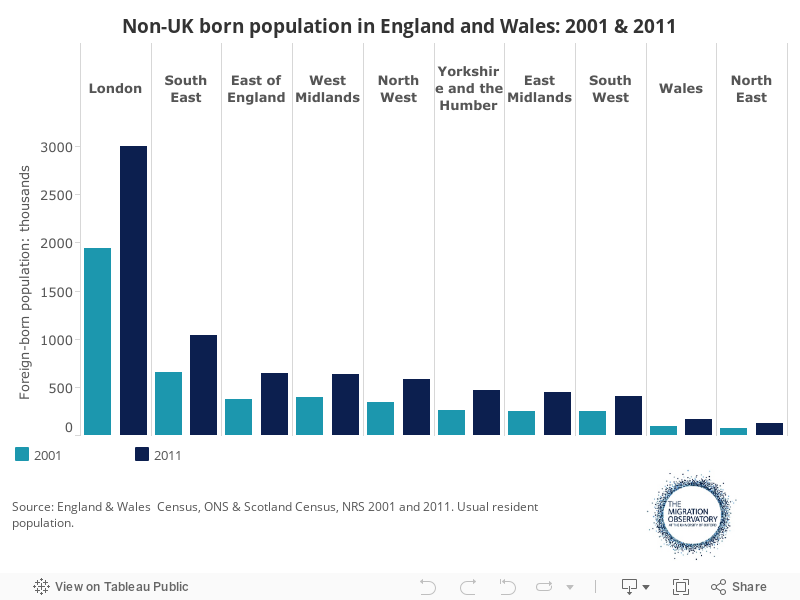
Figure 9 also shows that the foreign-born share of the regional population in London, nearly 37% of London’s resident population in 2011, is significantly higher than the average for England and Wales (13.4%) as well as for each region. The regions with the lowest share of the foreign-born population were Wales and the North East, where those born outside of the UK made up 5.5% and 5% of the residents respectively. After London, the region with the second highest non-UK born population was the South East (12.1%), closely followed by the West Midlands (11.2%) and the East (11%).
Figure 9
Evidence gaps and limitations
There are two main limitations of the census. Firstly, it is typically only conducted every 10 years. Therefore, other sources of information are important in order to update the information between censuses. Secondly, there are only a limited number of questions included in the census. Therefore, sources of information on the broader characteristics of the population can also complement the census information.
While the census aims to include the entire population, it does have a certain margin of error. For England and Wales as a whole, the relative confidence interval at the 95% confidence level published by the ONS was 0.15% (83,000 people more or less than the estimate). To give an example at the more local level, for Brent’s usually resident population, the relative confidence interval at the 95% level was 2.52%, suggesting a 95% probability that the true value of the population lies somewhere between 303,372 and 319,058 persons (ONS, 2012). Specific confidence intervals are not currently available for census data relating to country of birth.
References
- Office for National Statistics. “Detailed country of birth and nationality analysis from the 2011 Census of England and Wales.” London, May 2013.
- Office for National Statistics. “Confidence Intervals for the 2011 Census.” London, December 2012.
Related material
- Migration Observatory Briefing – Geographical Distribution and Characteristics of Long-Term International Flows to the UK
- Migration Observatory briefing – Migrants in the UK: An Overview
Further Information
Thanks to Peter Stokes for his helpful comments and suggestions on this briefing